. 2013 Mar 9:13:35.
doi: 10.1186/1471-2288-13-35.

A graphical tool for locating inconsistency in network meta-analyses

Affiliations

A graphical tool for locating inconsistency in network meta-analyses

Ulrike Krahn et al. BMC Med Res Methodol. .

Abstract

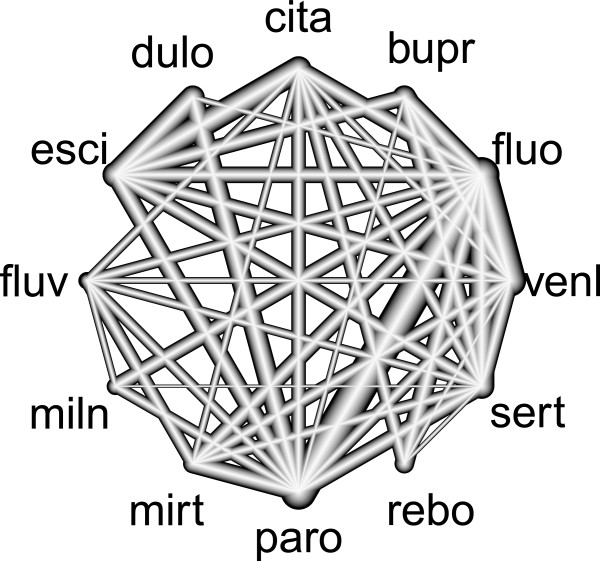
Background: In network meta-analyses, several treatments can be compared by connecting evidence from clinical trials that have investigated two or more treatments. The resulting trial network allows estimating the relative effects of all pairs of treatments taking indirect evidence into account. For a valid analysis of the network, consistent information from different pathways is assumed. Consistency can be checked by contrasting effect estimates from direct comparisons with the evidence of the remaining network. Unfortunately, one deviating direct comparison may have side effects on the network estimates of others, thus producing hot spots of inconsistency.

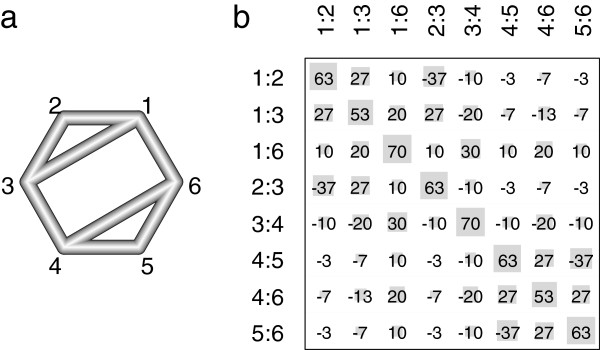
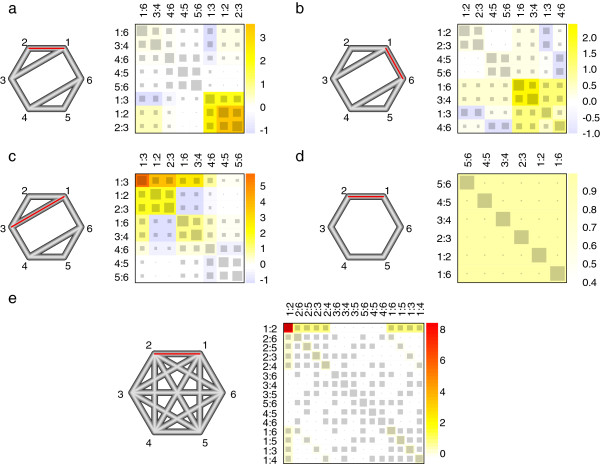
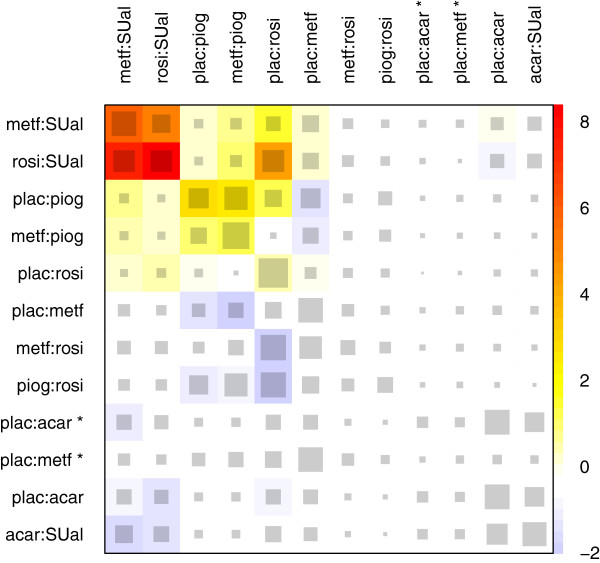
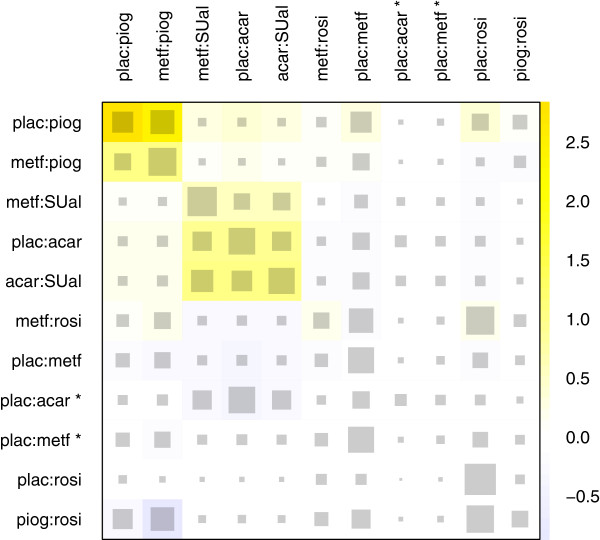
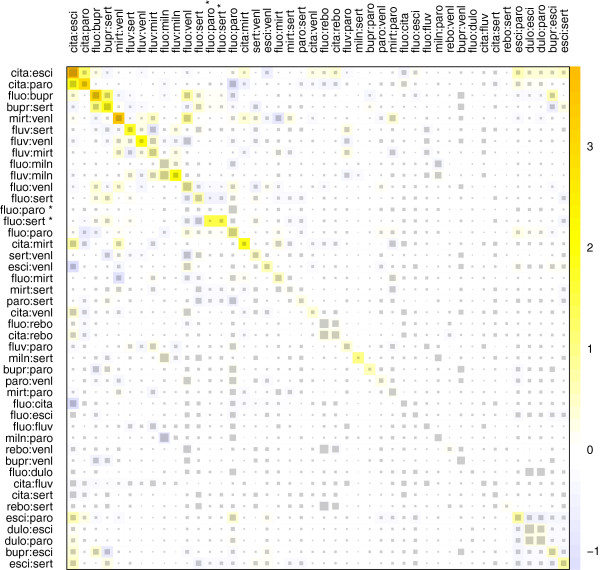
Methods: We provide a tool, the net heat plot, to render transparent which direct comparisons drive each network estimate and to display hot spots of inconsistency: this permits singling out which of the suspicious direct comparisons are sufficient to explain the presence of inconsistency. We base our methods on fixed-effects models. For disclosure of potential drivers, the plot comprises the contribution of each direct estimate to network estimates resulting from regression diagnostics. In combination, we show heat colors corresponding to the change in agreement between direct and indirect estimate when relaxing the assumption of consistency for one direct comparison. A clustering procedure is applied to the heat matrix in order to find hot spots of inconsistency.

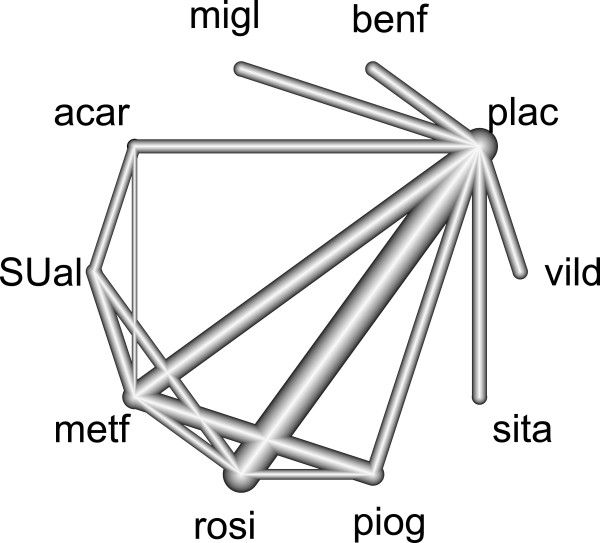
Results: The method is shown to work with several examples, which are constructed by perturbing the effect of single study designs, and with two published network meta-analyses. Once the possible sources of inconsistencies are identified, our method also reveals which network estimates they affect.

Conclusion: Our proposal is seen to be useful for identifying sources of inconsistencies in the network together with the interrelatedness of effect estimates. It opens the way for a further analysis based on subject matter considerations.


Figures

Figure 1
Figure 1
Network design and hat matrix of an illustrative network meta-analysis. In a), the network design of an illustrative example is given: six treatments and eight different observed designs based on two-armed studies. The nodes correspond to the treatments, and the edges show which treatments are directly compared. The thickness of an edge represents the inverse standard error (Vddir)1/2, which is equal one for all designs. In b), the resulting hat matrix at the design level is given in percent, which indicates the contribution of the direct estimate in design d (shown in the column) to the network estimate in design d’ (shown in the row). In addition, the absolute values of the matrix elements are visualized by the area of the gray squares.
Figure 2
Figure 2
Network design of an illustrative network meta-analysis. The nodes correspond to eight treatments and the edges display observed treatment comparisons. Design 6:7 and 3:4 do not contribute to the inconsistency assessment and are not incorporated into a net heat plot.
Figure 3
Figure 3
Five illustrative network meta-analyses with net heat plot. In a) to e), the network design is shown on the left: six treatments and six, eight or fifteen different observed designs based on two-armed studies. The nodes are placed on the circumcircle and are labeled according to the treatments. The edges show which treatments are directly compared. The thickness of an edge represents the inverse standard error (Vddir)1/2, which is equal one for all designs. We introduced inconsistency by perturbing the effect of one edge (marked in red) by five standard errors of the direct effect estimate. The corresponding net heat plots are shown on the right side: The area of the gray squares displays the contribution of the direct estimate in design d (shown in the column) to the network estimate in design d’ (shown in the row). The colors are associated with the change in inconsistency between direct and indirect evidence in design d’ (shown in the row) after detaching the effect of design d (shown in the column). Blue colors indicate an increase and warm colors indicate a decrease (the stronger the intensity of the color, the stronger the change).
Figure 4
Figure 4
Network design in the diabetes example. The nodes are placed on the circumcircle and are labeled according to the treatments. The edges display the observed treatment comparisons. The thickness of the edges is proportional to the inverse standard error of the treatment effects, aggregated over all studies including the two respective treatments. The network includes 25 two-armed studies on fourteen different designs and one three-armed study of design plac:acar:metf.
Figure 5
Figure 5
Net heat plot in the diabetes example. The area of the gray squares displays the contribution of the direct estimate in design d (shown in the column) to the network estimate in design d’ (shown in the row). The colors are associated with the change in inconsistency between direct and indirect evidence in design d’ (shown in the row) after detaching the effect of design d (shown in the column). Blue colors indicate an increase and warm colors indicate a decrease (the stronger the intensity of the color, the stronger the change). The two contrasts of the three-armed study with design plac:acar:metf are marked with .
Figure 6
Figure 6
Net heat plot in the diabetes example after exclusion of the study with design rosi:SUal. The area of the gray squares displays the contribution of the direct estimate in design d (shown in the column) to the network estimate in design d’ (shown in the row). The colors are associated with the change in inconsistency between direct and indirect evidence in design d’ (shown in the row) after detaching the effect of design d (shown in the column). Blue colors indicate an increase and warm colors indicate a decrease (the stronger the intensity of the color, the stronger the change). The two contrasts of the three-armed study with design plac:acar:metf are marked with .
Figure 7
Figure 7
Network design in the antidepressants example. The nodes are placed on the circumcircle and are labeled according to the treatments. The edges display the observed treatment comparisons. The thickness of the lines is proportional to the inverse standard error of the treatment effect, aggregated over all studies including these two respective treatments. The network includes 109 two-armed studies with 42 different designs and two three-armed studies, both with design fluo:paro:sert.
Figure 8
Figure 8
Net heat plot in the antidepressants example. The area of the gray squares displays the contribution of the direct estimate in design d (shown in the column) to the network estimate in design d’ (shown in the row). The colors are associated with the change in inconsistency between direct and indirect evidence in design d’ (shown in the row) after detaching the effect of design d (shown in the column). Blue colors indicate an increase and warm colors indicate a decrease (the stronger the intensity of the color, the stronger the change). The two contrasts of the two three-armed trials with design fluo:paro:sert are marked with .

References

    1. Wells GA, Sultan SA, Chen L, Khan M, Coyle D (Eds) Indirect Evidence: Indirect Treatment Comparisons in Meta-Analysis. Ottawa: Canadian Agency for Drugs and Technologies in Health; 2009.
    1. Hoaglin DC, Hawkins N, Jansen JP, Scott DA, Itzler R, Cappelleri JC, Boersma C, Thompson D, Larholt KM, Diaz M, Barrett A. Conducting indirect-treatment-comparison and network-meta-analysis studies: report of the ISPOR task force on indirect treatment comparisons good research practices: part 2. Value Health. 2011;14(4):429–437. doi: 10.1016/j.jval.2011.01.011. [ http://dx.doi.org/10.1016/j.jval.2011.01.011] - DOI - DOI - PubMed
    1. Dias S, Welton NJ, Sutton AJ, E AA (Eds) A Generalised Linear Modelling Framework for Pairwise and Network Meta-Analysis of Randomised Controlled Trials, NICE DSU: Technical Support Document 2; 2011. [ http://www.nicedsu.org.uk] - PubMed
    1. Salanti G. Indirect and mixed-treatment comparison, network, or multiple-treatments meta-analysis: many names, many benefits, many concerns for the next generation evidence synthesis tool. Res Syn Meth. 2012;3(2):80–97. doi: 10.1002/jrsm.1037. [ http://doi.wiley.com/10.1002/jrsm.1037] - DOI - DOI - PubMed
    1. Baker SG, Kramer BS. The transitive fallacy for randomized trials: if A bests B and B bests C in separate trials, is A better than C? BMC Med Res Methodol. 2002;2:13. doi: 10.1186/1471-2288-2-13. - DOI - PMC - PubMed

Publication types

LinkOut - more resources