. 2013 Mar 11;11(1):18.
doi: 10.1186/1478-811X-11-18.

Insulin and insulin like growth factor II endocytosis and signaling via insulin receptor B

Affiliations

Insulin and insulin like growth factor II endocytosis and signaling via insulin receptor B

Jimena Giudice et al. Cell Commun Signal. .

Abstract

Background: Insulin and insulin-like growth factors (IGFs) act on tetrameric tyrosine kinase receptors controlling essential functions including growth, metabolism, reproduction and longevity. The insulin receptor (IR) binds insulin and IGFs with different affinities triggering different cell responses.

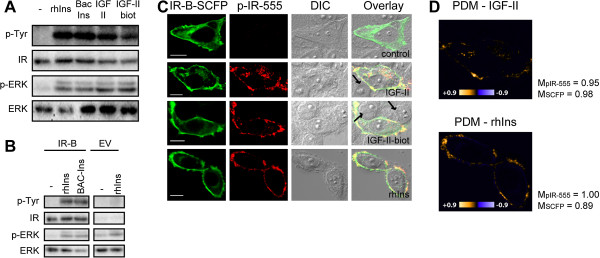
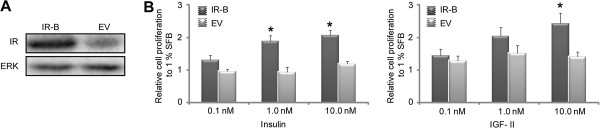
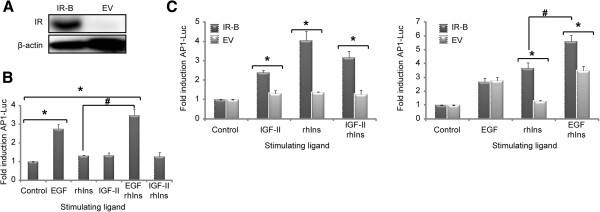
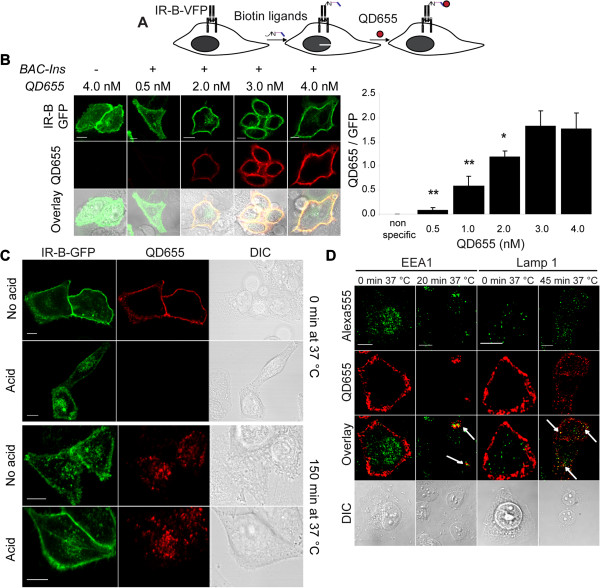
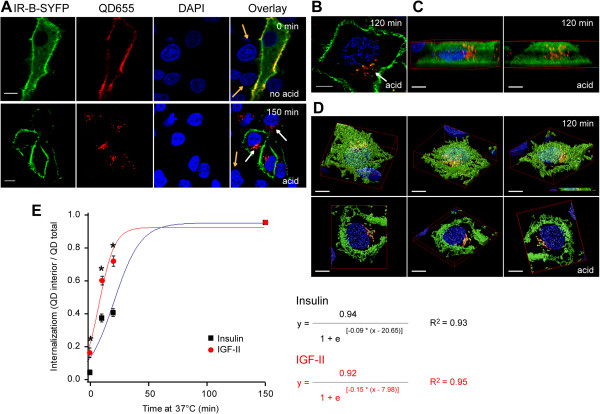
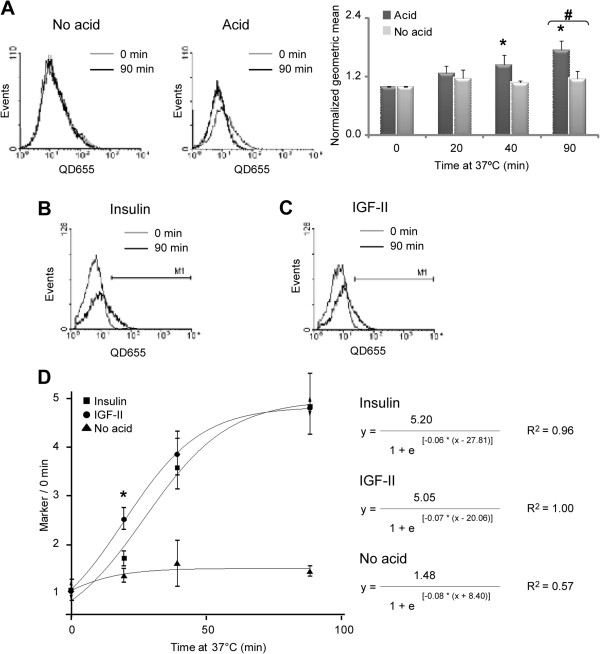
Results: We showed that IGF-II induces cell proliferation and gene transcription when IR-B is over-expressed. We combined biotinylated ligands with streptavidin conjugated quantum dots and visible fluorescent proteins to visualize the binding of IGF-II and insulin to IR-B and their ensuing internalization. By confocal microscopy and flow cytometry in living cells, we studied the internalization kinetic through the IR-B of both IGF-II, known to elicit proliferative responses, and insulin, a regulator of metabolism.

Conclusions: IGF-II promotes a faster internalization of IR-B than insulin. We propose that IGF-II differentially activates mitogenic responses through endosomes, while insulin-activated IR-B remains at the plasma membrane. This fact could facilitate the interaction with key effector molecules involved in metabolism regulation.


Figures

Figure 1
Figure 1
IR activation by IGF-II and IGF-II-biotin. A. HeLa cells over-expressing IR-B were starved for 16 hours and stimulated for 5 min with 100 nM rhIns, BAC-Ins, IGF-II or IGF-II-biot at 37°C. Lysates were analyzed by Western blot with anti-phosphorylated-Tyrosine (p-Tyr) and anti-IR-β subunit antibodies; and anti-phosphorylated-ERK 1/2 (p-ERK) and anti-ERK 1/2 antibodies. B. HeLa cells were transfected with pcDNA3-IR-B or EV stimulated or not with insulin for 5 min (bands were cut from the same gel). C. HeLa cells expressing IR-B-SCFP stimulated with 100 nM IGF-II, IGF-II-biot or rhIns for 5 min at 37°C, fixed in cold methanol and analyzed by immunofluorescence with anti-phosphorylated-IR-β subunit (Tyrosine 1361) antibody and a secondary antibody conjugated with Alexa fluor 555. Imaging was performed by confocal microscopy (Olympus Fluoview FV1000). Scale bars: 10 μm. Arrows indicate that non transfected cells do not show activation signal upon ligand stimulation. Arrows indicate non transfected cells. D. Colocalization analysis performed with Image J. Product of the differences from the mean (PDM) plots and Manders coefficients for each channel (MpIR-555 and MSCFP) are shown for stimulation with IGF-II and rhIns.
Figure 2
Figure 2
Proliferative response of IGF-II and rhIns through IR-B. A. HeLa cells transiently transfected with pcDNA3-IR-B or EV were assayed by Western blot detecting the expression of IR and ERK 1/2 (loading control). B. MTS assay in cells transiently transfected with pcDNA3-IR-B or EV stimulated with 0.1 nM, 1.0 nM and 10.0 nM IGF-II or rhIns for 2 days. The results are shown as the mean ± s.e.m (n = 3 independent experiments). Asterisks indicate significant differences between IR and EV (p < 0.05).
Figure 3
Figure 3
AP-1 mediated gene transcription induced by IGF-II via IR-B. A. HeLa cells transiently transfected with pcDNA3-IR-B or the EV assayed by Western blot detecting the expression of IR and β-actin (loading control). B. Luciferase activity on cells transfected with pAP1-Luc and EV. After 24 hours, serum was depleted for 1 day and cells were stimulated for 16 hours with: 1.6 nM EGF, 100 nM rhIns, 100 nM IGF-II, 1.6 nM EGF + 100nM rhIns or 100 nM IGF-II + 100 nM rhIns. Luciferase induction was calculated as the ratio between stimulated and non-stimulated cells. The results are shown as the mean ± s.e.m (n = 4 independent experiments for EGF, rhIns and EGF + rhIns; n = 3 independent experiments for IGF-II and IGF-II + rhIns and n = 7 for rhIns). Asterisks indicate significant differences (p = 0.005) with non transfected cells (control). C. Cells cotransfected with pAP1-Luc and pcDNA3-IR-B or EV were stimulated with: 1.6 nM EGF, 100 nM rhIns, 100 nM IGF-II, 1.6 nM EGF + 100nM rhIns or 100 nM IGF-II + 100 nM rhIns for 16 hours and luciferase activity was measured. The results are shown as the mean ± s.e.m. (n = 4 independent experiments for EGF, rhIns and EGF + rhIns; n = 3 independent experiments for IGF-II and IGF-II + rhIns). Asterisks indicate significant differences (p < 0.01) between cells over-expressing IR-B with cells transfected with EV. In B and C panels the symbol # indicates that AP-1-Luc response after EGF + rhIns stimulation is significantly different form rhIns alone either in cells over-expressing IR-B (p = 0.007) or in cells transfected with EV (p = 0.005).
Figure 4
Figure 4
Imaging of biotinylated ligands binding and internalization by QDs. A. Labeling strategy. B. QD655 concentration curve: HeLa cells expressing IR-B-GFP were labeled with 50 nM BAC-Ins for 15 min and different concentration of QD655 (0.5 nM to 4.0 nM) for 10 min at 15°C. Quantification of the ratio between QD655 and GFP signal (GFP/QD655). Asterisks indicate significant differences: * p < 0.0001 and ** p = 0.01 (n = 6–10 cells). C. HeLa cells expressing IR-B-GFP were labeled in vivo with 50 nM BAC-Ins and 1 nM QD655 at 15°C and further either directly fixed in 3.7% PFA or treated with acid solution (0.5 M NaCl, 0.1 M Na-glycine pH 3.0) for 5 min and washed before fixation. The two bottom panels show similar experiments but the cells were incubated at 37°C for 150 min before acid treatment and/or fixation. In all the cases imaging was performed by confocal microscopy (Zeiss LSM 510 Meta). Scale bars: 10 μm. D. HeLa cells expressing IR-B were labeled with 50 nM BAC-Ins and 1 nM QD655 at room temperature. Samples were incubated or not at 37°C and then fixed in 3.7% PFA. Immunofluorescence was performed with antibodies against early endosomes (EEA1) or CD63 (Lamp 1). Secondary antibodies were conjugated with Alexa fluor 555. Imaging was performed by confocal microscopy (Olympus Fluoview FV 1000). Scale bars: 10 μm.
Figure 5
Figure 5
IGF-II binding and internalization via IR by confocal microscopy. A. HeLa cells expressing IR-B-SYFP were labeled in vivo with 50 nM IGF-II-biot and 2 nM QD655 at room temperature and fixed in 3.7% PFA. Lower panel shows cells incubated at 37°C for 150 min after labeling and treated with acid (0.5 M NaCl, 0.1 M Na-glycine pH 3) for 5 min before fixation. Imaging was performed by confocal microscopy (Olympus Fluoview FV 1000). Scale bars: 10 μm. B. HeLa cells expressing IR-B-GFP were labeled in vivo with 50 nM IGF-II-biot and 2 nM QD655, incubated for 1 hour at 37°C, then with 0.1 mM Na-glycine pH 3, NaCl 0.5 M for 5 min and fixed in 3.7% PFA. Images were taken with a confocal microscope (Olympus Fluoview FV 1000) by acquisition of 64 z-slices with 16 μm step size. Deconvolution was performed with Huygens Scientific Volume Imaging Huygens Professional Version 3.6, applying the Quick maximum likelihood estimation algorithm. Tridimensional reconstructions are shown. C. Maximum intensity projection. D. Surface renderer. Different views are shown. Lower panels show views of 14 z-slices section (2.24 μm) that is shown in the right lower corner of the third panel. Scale bars: 5 μm. E. Quantification of the degree of internalization of insulin and IGF-II (ratio between QDinterior and QDtotal). The results are shown as the mean ± s.e.m (n = 19–29 cells). Asterisks indicate significant differences between ligands (p ≤ 0.02). In A and B white arrows indicate internalized QD655 and orange arrows label non transfected cells.
Figure 6
Figure 6
Internalization of IGF-II and insulin through IR-B by flow cytometry. A. HeLa cells expressing IR-B-SYFP labeled in vivo with 50 nM BAC-Ins and 1 nM QD655 at room temperature were incubated at 37°C for different times. Cells were treated or not with acid for 2 min, before collection with 0.5 mM EDTA in PBS and analyzed by flow cytometry detecting SYFP and QD655 signals. QD655 histograms were performed with the population of events which were SYFP positive (transfected cells). Overlays of histograms from cells incubated at 37°C for 90 min and non-incubated cells for each ligand treatment. In each histogram the geometric mean was calculated and was normalized with respect to the time defined as zero. Black asterisks show significant differences with the time defined as zero (p ≤ 0.05; n = 3 independent experiments). Numeral symbol indicates significant differences between acid and non acid treatments (p = 0.01; n = 3 independent experiments). B-C. Similar experiments with BAC-Ins (B) or IGF-II-biot (C). D. In each histogram a marker M1 was determined including approximately 4% of the events at the time defined as zero. The percentage of events inside region M1 was measured and normalized with respect to the time defined as zero (Marker/0 min). The results are shown as the mean ± s.e.m (n = 5 independent experiments). Asterisk indicates significant differences between ligands (p = 0.01).

Similar articles

Cited by

References

    1. Chan SJ, Steiner DF. Insulin through the ages: phylogeny of a growth promoting and metabolic regulatory hormone. Am Zool. 2000;40:213–222. doi: 10.1668/0003-1569(2000)040[0213:ITTAPO]2.0.CO;2. - DOI
    1. Kimura KD, Tissenbaum HA, Liu Y, Ruvkun G. daf-2, an insulin receptor-like gene that regulates longevity and diapause in Caenorhabditis elegans. Science. 1997;277:942–946. doi: 10.1126/science.277.5328.942. - DOI - PubMed
    1. Efstratiadis A. Genetics of mouse growth. Int J Dev. Biol. 1998;42:955–976. - PubMed
    1. Tissenbaum HA, Ruvkun G. An insulin-like signaling pathway affects both longevity and reproduction in Caenorhabditis elegans. Genetics. 1998;148:703–717. - PMC - PubMed
    1. Brogiolo W, Stocker H, Ikeya T, Rintelen F, Fernandez R. An evolutionarily conserved function of the Drosophila insulin receptor and insulin-like peptides in growth control. Curr Biol. 2001;11:213–221. doi: 10.1016/S0960-9822(01)00068-9. - DOI - PubMed

LinkOut - more resources