

Rapid birth-and-death evolution of the xenobiotic metabolizing NAT gene family in vertebrates with evidence of adaptive selection
- PMID: 23497148
- PMCID: PMC3601968
- DOI: 10.1186/1471-2148-13-62
Rapid birth-and-death evolution of the xenobiotic metabolizing NAT gene family in vertebrates with evidence of adaptive selection
Abstract
Background: The arylamine N-acetyltransferases (NATs) are a unique family of enzymes widely distributed in nature that play a crucial role in the detoxification of aromatic amine xenobiotics. Considering the temporal changes in the levels and toxicity of environmentally available chemicals, the metabolic function of NATs is likely to be under adaptive evolution to broaden or change substrate specificity over time, making NATs a promising subject for evolutionary analyses. In this study, we trace the molecular evolutionary history of the NAT gene family during the last ~450 million years of vertebrate evolution and define the likely role of gene duplication, gene conversion and positive selection in the evolutionary dynamics of this family.
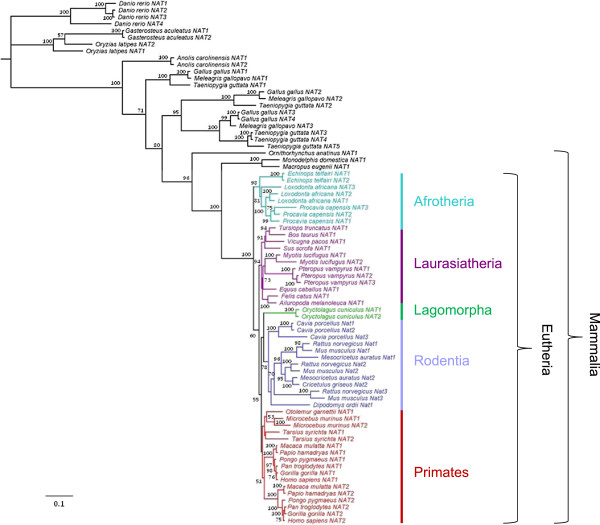
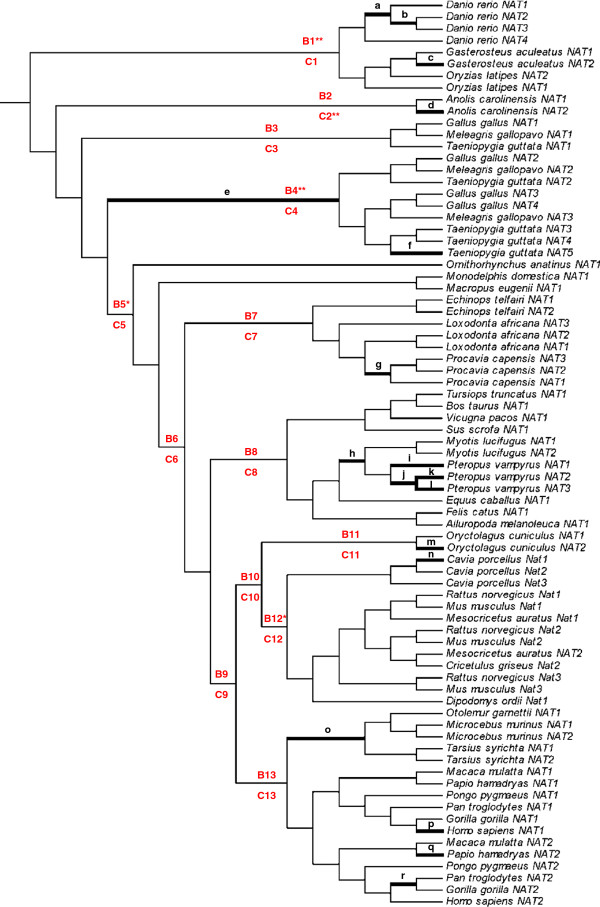
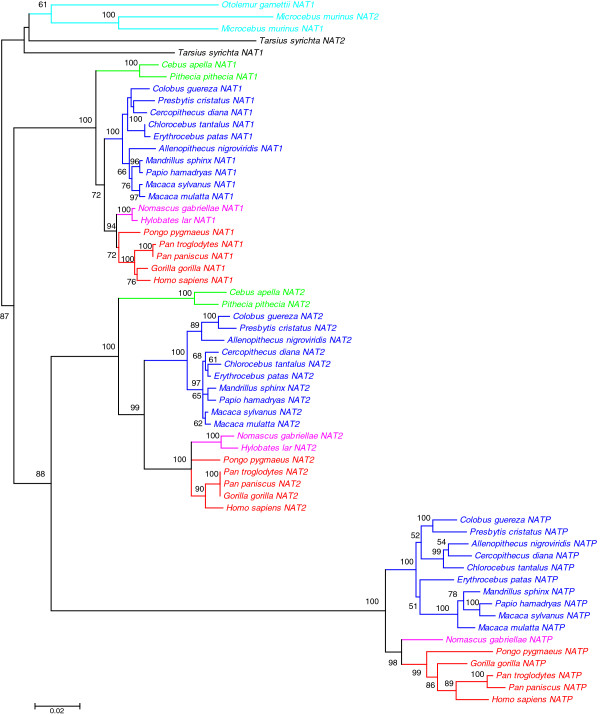
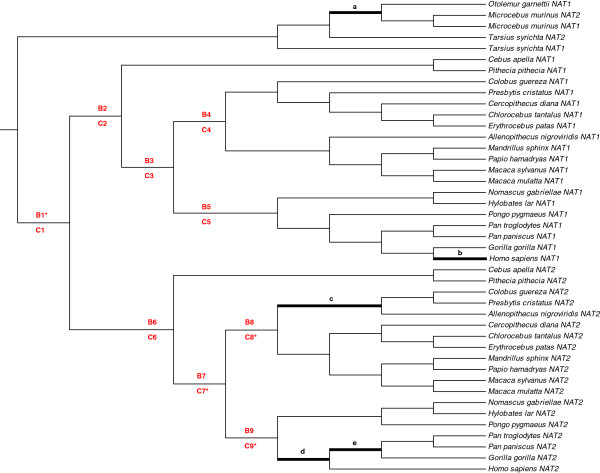
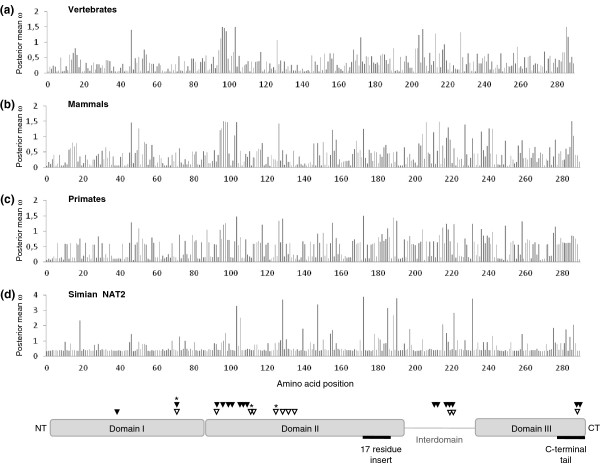
Results: A phylogenetic analysis of 77 NAT sequences from 38 vertebrate species retrieved from public genomic databases shows that NATs are phylogenetically unstable genes, characterized by frequent gene duplications and losses even among closely related species, and that concerted evolution only played a minor role in the patterns of sequence divergence. Local signals of positive selection are detected in several lineages, probably reflecting response to changes in xenobiotic exposure. We then put a special emphasis on the study of the last ~85 million years of primate NAT evolution by determining the NAT homologous sequences in 13 additional primate species. Our phylogenetic analysis supports the view that the three human NAT genes emerged from a first duplication event in the common ancestor of Simiiformes, yielding NAT1 and an ancestral NAT gene which in turn, duplicated in the common ancestor of Catarrhini, giving rise to NAT2 and the NATP pseudogene. Our analysis suggests a main role of purifying selection in NAT1 protein evolution, whereas NAT2 was predicted to mostly evolve under positive selection to change its amino acid sequence over time. These findings are consistent with a differential role of the two human isoenzymes and support the involvement of NAT1 in endogenous metabolic pathways.
Conclusions: This study provides unequivocal evidence that the NAT gene family has evolved under a dynamic process of birth-and-death evolution in vertebrates, consistent with previous observations made in fungi.
Figures
Similar articles
-
In silico sequence analysis of arylamine N-acetyltransferases: evidence for an absence of lateral gene transfer from bacteria to vertebrates and first description of paralogs in bacteria.Biochem Biophys Res Commun. 2002 May 3;293(2):783-92. doi: 10.1016/S0006-291X(02)00299-1. Biochem Biophys Res Commun. 2002. PMID: 12054539
-
Comparative genomic and phylogenetic investigation of the xenobiotic metabolizing arylamine N-acetyltransferase enzyme family.FEBS Lett. 2010 Jul 16;584(14):3158-64. doi: 10.1016/j.febslet.2010.05.063. Epub 2010 Jun 2. FEBS Lett. 2010. PMID: 20621844
-
Molecular and Functional Characterization of N-Acetyltransferases in Common Marmosets and Pigs.Drug Metab Dispos. 2022 Nov;50(11):1429-1433. doi: 10.1124/dmd.122.000919. Epub 2022 Jun 29. Drug Metab Dispos. 2022. PMID: 35768074
-
Arylamine N-acetyltransferases: structural and functional implications of polymorphisms.Toxicology. 2008 Dec 30;254(3):170-83. doi: 10.1016/j.tox.2008.08.022. Epub 2008 Sep 12. Toxicology. 2008. PMID: 18852012 Review.
-
Arylamine N-acetyltransferases: what we learn from genes and genomes.Drug Metab Rev. 2005;37(3):511-64. doi: 10.1080/03602530500251204. Drug Metab Rev. 2005. PMID: 16257833 Review.
Cited by
-
Genetic Adaptations in Mudskipper and Tetrapod Give Insights into Their Convergent Water-to-Land Transition.Animals (Basel). 2021 Feb 23;11(2):584. doi: 10.3390/ani11020584. Animals (Basel). 2021. PMID: 33672418 Free PMC article.
-
Structures and functions of insect arylalkylamine N-acetyltransferase (iaaNAT); a key enzyme for physiological and behavioral switch in arthropods.Front Physiol. 2015 Apr 13;6:113. doi: 10.3389/fphys.2015.00113. eCollection 2015. Front Physiol. 2015. PMID: 25918505 Free PMC article.
-
Structural and functional evolution of positively selected sites in pine glutathione S-transferase enzyme family.J Biol Chem. 2013 Aug 23;288(34):24441-51. doi: 10.1074/jbc.M113.456863. Epub 2013 Jul 11. J Biol Chem. 2013. PMID: 23846689 Free PMC article.
-
Specific Gene Duplication and Loss of Cytochrome P450 in Families 1-3 in Carnivora (Mammalia, Laurasiatheria).Animals (Basel). 2022 Oct 18;12(20):2821. doi: 10.3390/ani12202821. Animals (Basel). 2022. PMID: 36290207 Free PMC article.
-
GWAS identifies an NAT2 acetylator status tag single nucleotide polymorphism to be a major locus for skin fluorescence.Diabetologia. 2014 Aug;57(8):1623-34. doi: 10.1007/s00125-014-3286-9. Epub 2014 Jun 17. Diabetologia. 2014. PMID: 24934506 Free PMC article.
References
MeSH terms
Substances
LinkOut - more resources
Full Text Sources
Other Literature Sources
