Comparative Study
. 2013 Mar 9:14:91.
doi: 10.1186/1471-2105-14-91.

A comparison of methods for differential expression analysis of RNA-seq data

Affiliations
Comparative Study

A comparison of methods for differential expression analysis of RNA-seq data

Charlotte Soneson et al. BMC Bioinformatics. .

Abstract

Background: Finding genes that are differentially expressed between conditions is an integral part of understanding the molecular basis of phenotypic variation. In the past decades, DNA microarrays have been used extensively to quantify the abundance of mRNA corresponding to different genes, and more recently high-throughput sequencing of cDNA (RNA-seq) has emerged as a powerful competitor. As the cost of sequencing decreases, it is conceivable that the use of RNA-seq for differential expression analysis will increase rapidly. To exploit the possibilities and address the challenges posed by this relatively new type of data, a number of software packages have been developed especially for differential expression analysis of RNA-seq data.

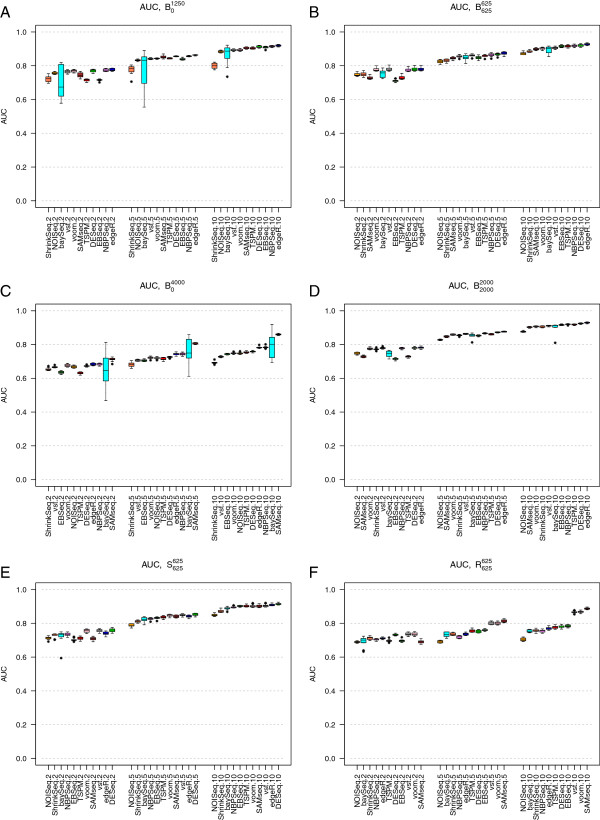
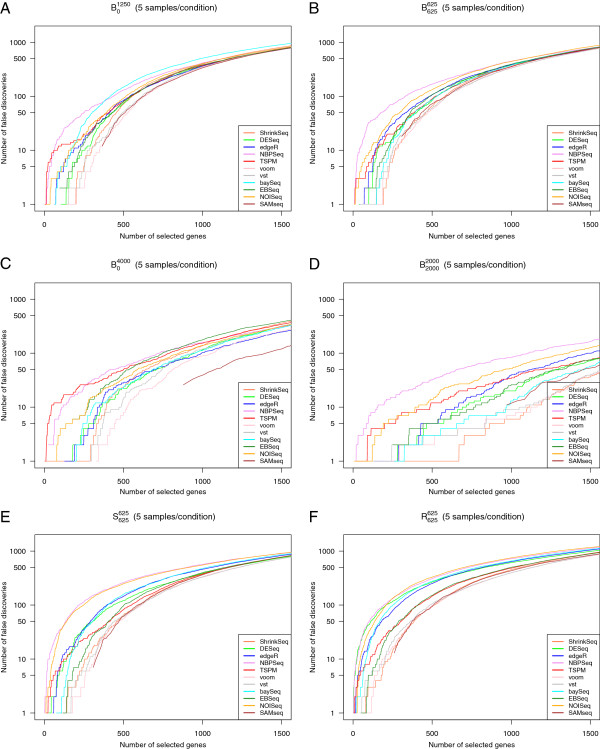
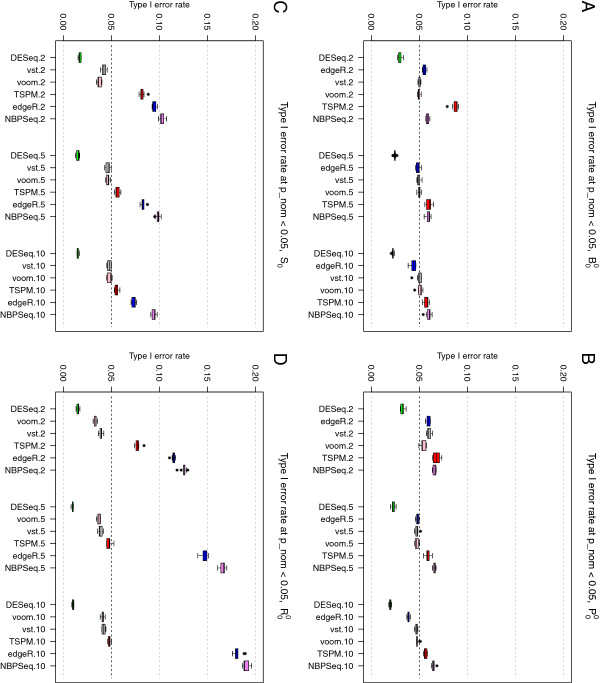
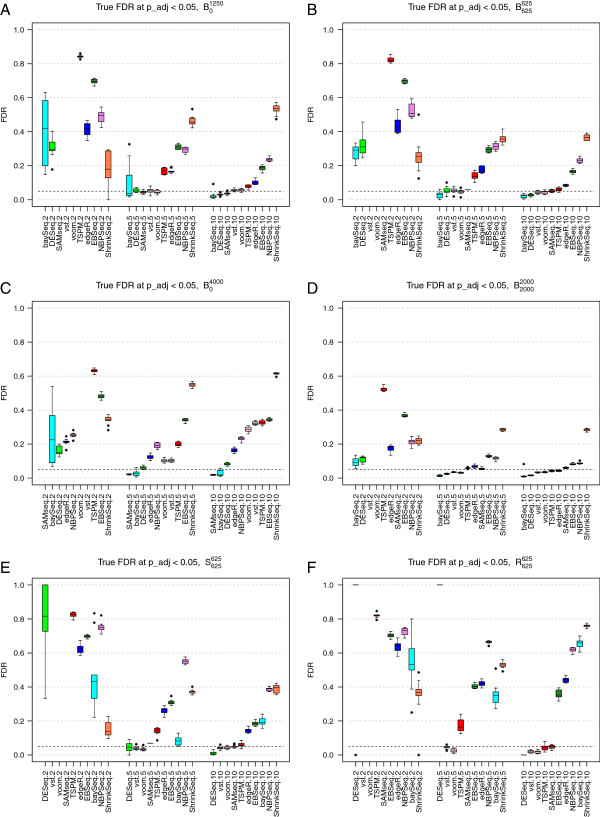
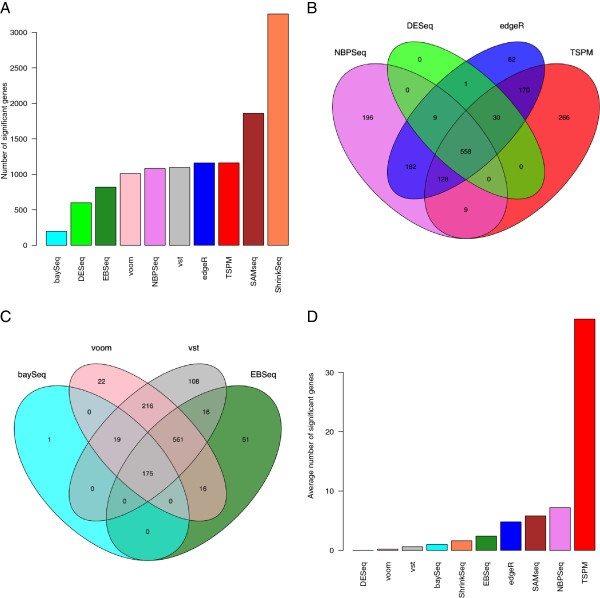
Results: We conducted an extensive comparison of eleven methods for differential expression analysis of RNA-seq data. All methods are freely available within the R framework and take as input a matrix of counts, i.e. the number of reads mapping to each genomic feature of interest in each of a number of samples. We evaluate the methods based on both simulated data and real RNA-seq data.

Conclusions: Very small sample sizes, which are still common in RNA-seq experiments, impose problems for all evaluated methods and any results obtained under such conditions should be interpreted with caution. For larger sample sizes, the methods combining a variance-stabilizing transformation with the 'limma' method for differential expression analysis perform well under many different conditions, as does the nonparametric SAMseq method.


Figures

Figure 1
Figure 1
Area under the ROC curve (AUC). Area under the ROC curve (AUC) for the eleven evaluated methods, in simulation studies B01250 (panel A), B625625 (panel B), B04000 (panel C), B20002000 (panel D), S625625 (panel E) and R625625 (panel F). The boxplots summarize the AUCs obtained across 10 independently simulated instances of each simulation study. Each panel shows the AUCs across three sample sizes (|S1| = |S2| = 2, 5 and 10, respectively, signified by the last number in the tick labels). The methods are ordered according to their median AUC for the largest sample size. When all DE genes were regulated in the same direction, increasing the number of DE genes from 1,250 (panel A) to 4,000 (panel C) impaired the performance of all methods. In contrast, when the DE genes were regulated in different directions (panels B and D), the number of DE genes had much less impact. The variability of the performance of baySeq was much higher when all genes were regulated in the same direction (panels A and C) compared to when the DE genes were regulated in different directions (panels B and D). Including outliers (panels E and F) decreased the AUC for most methods (compare to panel B), but less so for the transformation-based methods (voom+limma and vst+limma) and SAMseq.
Figure 2
Figure 2
False discovery curves. Representative false discovery curves, depicting the number of false positives encountered among the T top-ranked genes by the eleven evaluated methods, for T between 0 and 1,500. In all cases, there were 5 samples per condition. A: Simulation study B01250. B: Simulation study B625625. C: Simulation study B04000D: Simulation study B20002000. E: Simulation study S625625F: Simulation study R625625. Some of the curves do not pass through the origin, since many genes obtained the same ranking score and had to be called simultaneously.
Figure 3
Figure 3
Type I error rates. Type I error rates, for the six methods providing nominal p-values, in simulation studies B00 (panel A), P00 (panel B), S00 (panel C) and R00 (panel D). Letting some counts follow a Poisson distribution (panel B) reduced the type I error rates for TSPM slightly but had overall a small effect. Including outliers with abnormally high counts (panels C and D) had a detrimental effect on the ability to control the type I error for edgeR and NBPSeq, while DESeq became slightly more conservative.
Figure 4
Figure 4
True false discovery rates. True false discovery rates (FDR) observed for an imposed FDR threshold of 0.05, for the nine methods returning adjusted p-values or FDR estimates, in simulation studies B01250 (panel A), B625625 (panel B), B04000 (panel C) B20002000, (panel D), S625625 (panel E) and R625625 (panel F). With only two samples per condition, three of the methods (vst+limma, voom+limma and SAMseq) did not call any DE genes, and the FDR was considered to be undefined.
Figure 5
Figure 5
Analysis of the Bottomly data set. A: The number of genes found to be significantly DE between the two mouse strains in the Bottomly data set. B-C: Overlap among the set of DE genes found by different methods. D: The average number of genes found to be significantly DE genes when contrasting two subsets of mice from the same strain, in which case we expect no truly DE genes.

References

    1. Mortazavi A, Williams BA, McCue K, Schaeffer L, Wold B. Mapping and quantifying mammalian transcriptomes by RNA-Seq. Nat Methods. 2008;5(7):621–628. doi: 10.1038/nmeth.1226. - DOI - PubMed
    1. Chen G, Wang C, Shi T. Overview of available methods for diverse RNA-Seq data analyses. Sci China Life Sci. 2011;54:1121–1128. - PubMed
    1. Oshlack A, Robinson MD, Young MD. From RNA-seq reads to differential expression results. Genome Biol. 2010;11:220. doi: 10.1186/gb-2010-11-12-220. - DOI - PMC - PubMed
    1. Agarwal A, Koppstein D, Rozowsky J, Sboner A, Habegger L, Hillier LW, Sasidharan R, Reinke V, Waterston RH, Gerstein M. Comparison and calibration of transcriptome data from RNA-Seq and tiling arrays. BMC Genomics. 2010;11:383. doi: 10.1186/1471-2164-11-383. - DOI - PMC - PubMed
    1. Bradford JR, Hey Y, Yates T, Li Y, Pepper SD, Miller CJ. A comparison of massively parallel nucleotide sequencing with oligonucleotide microarrays for global transcription profiling. BMC Genomics. 2010;11:282. doi: 10.1186/1471-2164-11-282. - DOI - PMC - PubMed

Publication types