. 2013 Mar 13:13:9.
doi: 10.1186/1471-2342-13-9.

Histological image classification using biologically interpretable shape-based features

Affiliations

Histological image classification using biologically interpretable shape-based features

Sonal Kothari et al. BMC Med Imaging. .

Abstract

Background: Automatic cancer diagnostic systems based on histological image classification are important for improving therapeutic decisions. Previous studies propose textural and morphological features for such systems. These features capture patterns in histological images that are useful for both cancer grading and subtyping. However, because many of these features lack a clear biological interpretation, pathologists may be reluctant to adopt these features for clinical diagnosis.

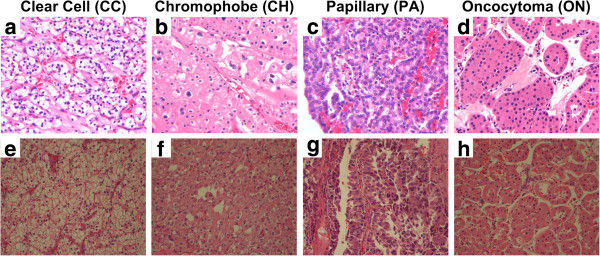
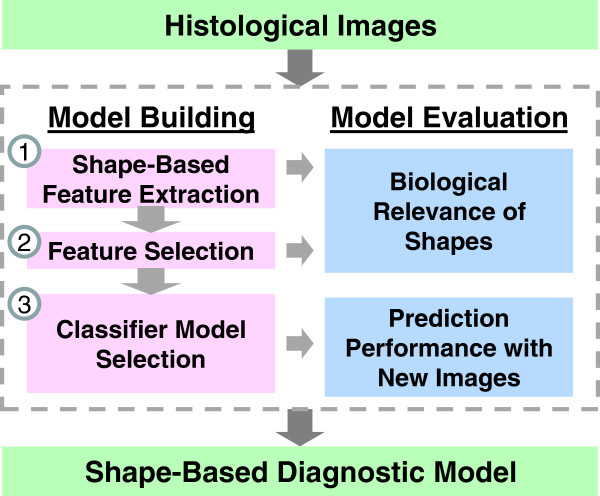
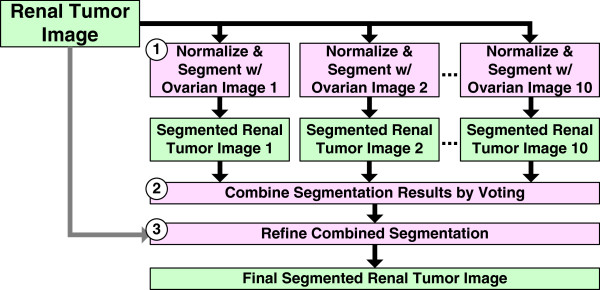
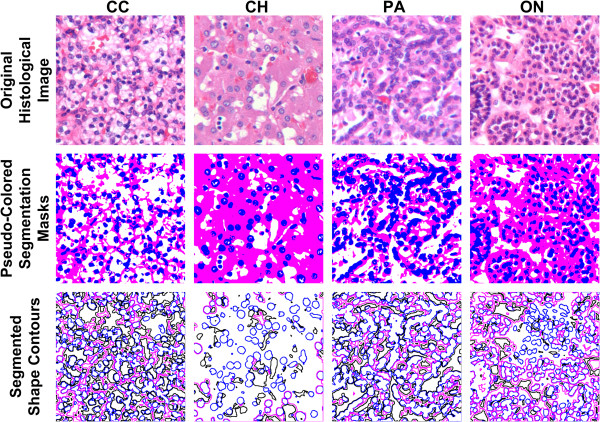
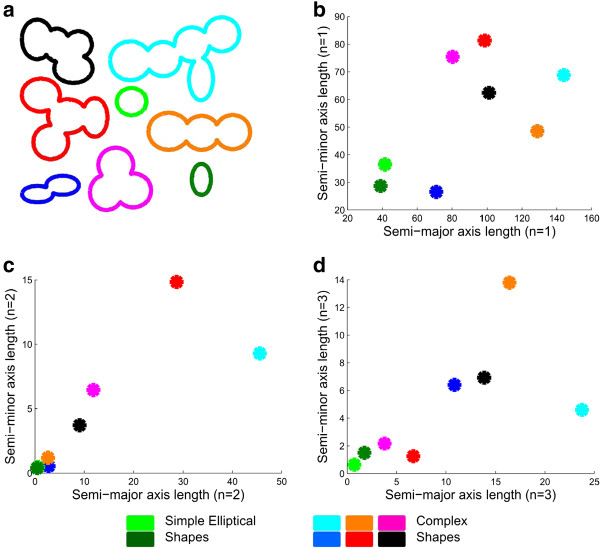
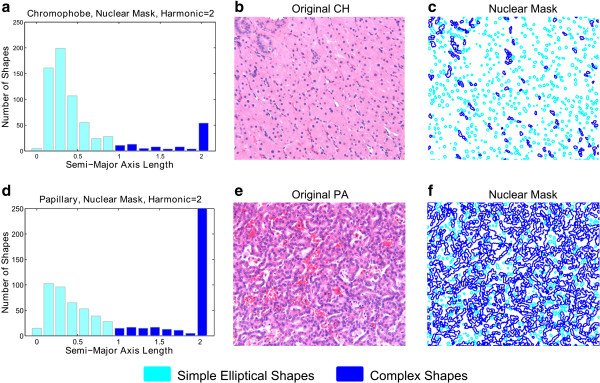
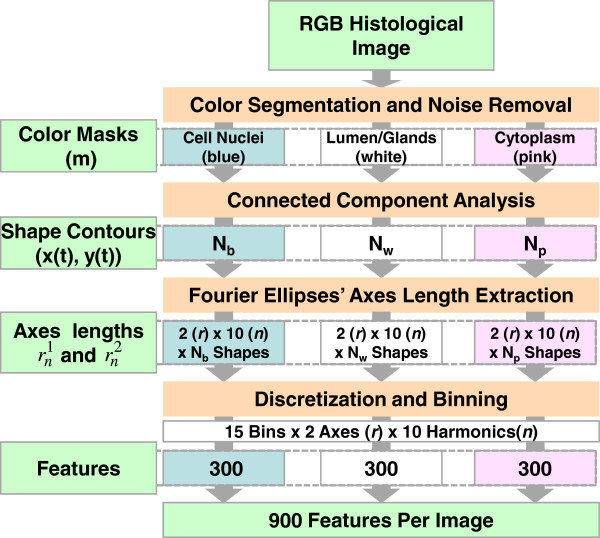
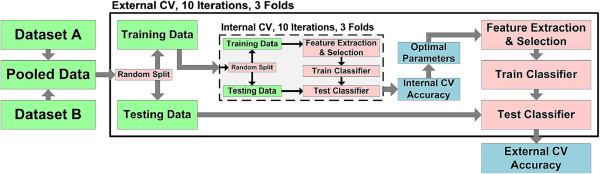
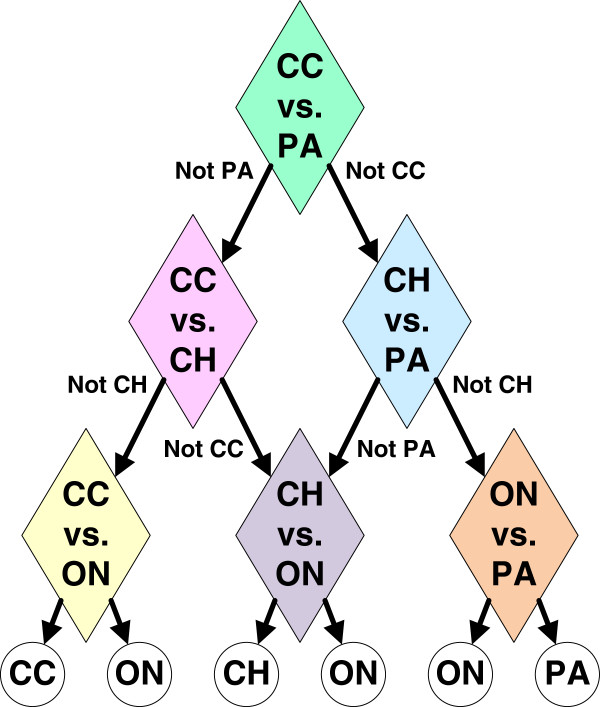
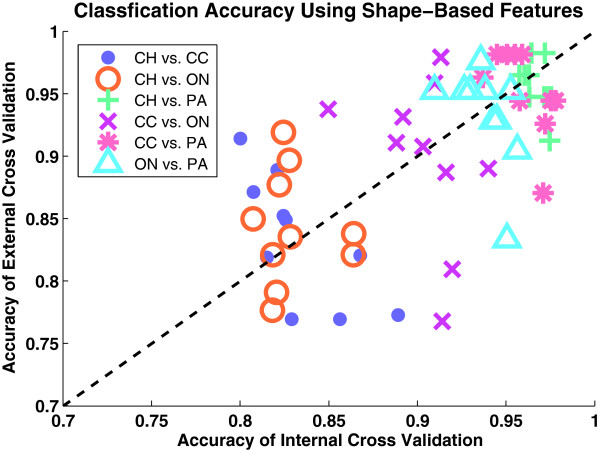
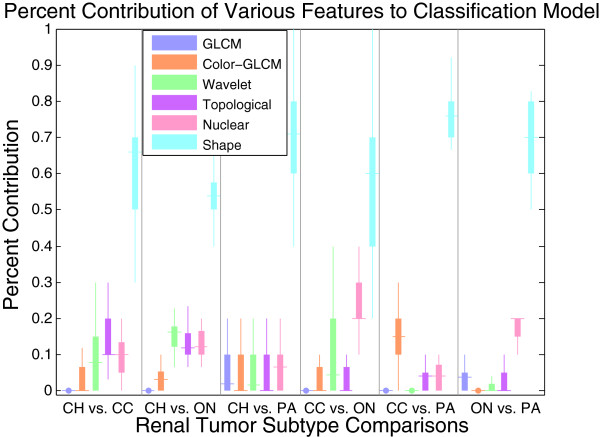
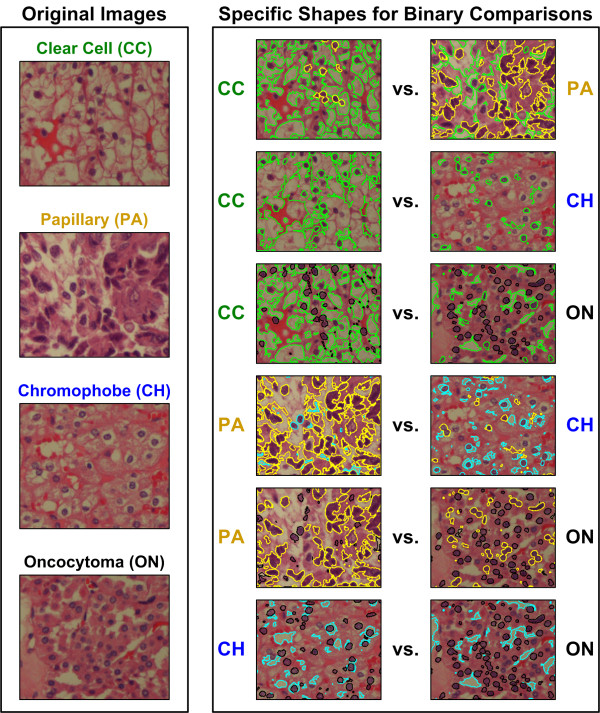
Methods: We examine the utility of biologically interpretable shape-based features for classification of histological renal tumor images. Using Fourier shape descriptors, we extract shape-based features that capture the distribution of stain-enhanced cellular and tissue structures in each image and evaluate these features using a multi-class prediction model. We compare the predictive performance of the shape-based diagnostic model to that of traditional models, i.e., using textural, morphological and topological features.

Results: The shape-based model, with an average accuracy of 77%, outperforms or complements traditional models. We identify the most informative shapes for each renal tumor subtype from the top-selected features. Results suggest that these shapes are not only accurate diagnostic features, but also correlate with known biological characteristics of renal tumors.

Conclusions: Shape-based analysis of histological renal tumor images accurately classifies disease subtypes and reveals biologically insightful discriminatory features. This method for shape-based analysis can be extended to other histological datasets to aid pathologists in diagnostic and therapeutic decisions.


Figures

Figure 1
Figure 1
Example images of four H&E stained histological renal tumor subtypes in datasets A (a-d) and B (e-h). Among four subtypes, three are renal cell carcinoma (RCC) subtypes: (a and e) clear cell, (b and f) chromophobe, and (c and g) papillary. The fourth subtype is a benign renal (d and h) oncocytoma tumor.
Figure 2
Figure 2
Building and evaluating a shape-based diagnostic model using histological images. We use three steps to derive a shape-based diagnostic model from histological images: 1) shape-based feature extraction (including automatic color segmentation, individual shape descriptor extraction, and discretization), 2) feature selection using the minimum redundancy-maximum relevance (mRMR) method, and 3) classifier model selection using cross-validation to identify optimal model parameters (i.e., feature size, Fourier shape descriptor harmonics, and SVM parameters). We evaluate the selected features and the classifier model by examining the biological relevance of the top selected features and by classifying independent images (using nested cross-validation).
Figure 3
Figure 3
Renal tumor images are automatically segmented using ten reference ovarian cancer images. The three main steps of the system are 1) normalization and segmentation using each reference image, 2) combination of segmentation labels by voting, and 3) refinement of combined segmentation by re-classifying pixels in the original color space.
Figure 4
Figure 4
Color segmentation results and shape contours in three masks for four renal tumor subtypes: clear cell (CC), chromophobe (CH), papillary (PA), and oncocytoma (ON).First row: original histological renal tumor subtype images; second row: pseudo colored segmentation masks, where blue, white and pink colors correspond to nuclear, cytoplasmic and no-stain/glandular masks, respectively; third row: segmented shape contours in nuclear (blue), no-stain/glandular (black), and cytoplasmic (pink) masks.
Figure 5
Figure 5
Axis lengths of shape descriptors capture the complexity of shapes in synthetic images. a) We use several synthetic shapes to illustrate the utility of Fourier shape descriptors in capturing shape complexity. The green and light green shapes are the simplest elliptical shapes. b-d) Major and minor axis lengths (in pixels) of the Fourier descriptor ellipses in (a), for harmonics n = 1, 2 and 3. Marker colors in (b-d) correspond to shape colors in (a). For first harmonic (n = 1), axis lengths represent size and eccentricity of the shape. For n > 1, axis lengths represent the detail or complexity of the shape. Therefore, simple green shapes (closer to an ellipse) have small axis lengths, while other complex shapes have larger axis lengths.
Figure 6
Figure 6
Fourier shape features discriminate simple and complex shapes in histological renal tumor images. The bar graphs illustrate the distribution of the second harmonic’s major axis length of all the shapes in the nuclear mask for (a) a chromophobe and (d) a papillary image. (b) - (c) and (e) - (f) are original image and nuclear mask shapes of chromophobe and papillary, respectively. Cyan shapes: simple elliptical nuclei for which the 2nd harmonic major axis length, representing amount of detail, falls in the first seven bins of the histogram (cyan bars in the bar graph); Blue shapes: complex nuclear clusters for which the 2nd harmonic major axis length falls in the last seven bins of the histogram (blue bars in the bar graph). It can be observed that, due to the complex clusters of nuclei, papillary has more shapes that have high major axis lengths. Therefore, the frequency of shapes in these bins can be an informative feature for distinguishing papillary from chromophobe.
Figure 7
Figure 7
The data flow for extraction of 900 shape-based features from a histological image. First, we segment the RGB histological image based on stains: blue (nuclei), pink (cytoplasm), and white (no-stain/gland). Then based on segmented results, we generate three binary masks corresponding to three stains (blue:b, white:w, pink:p). For each mask, we obtain the contour for all shapes after noise filtering using connected component analysis. Nm is number of shapes in m mask, where m ∈ {b, w, p}. We then extract shape axes descriptors (2 axes*10 harmonics) for each shape contour and bin them to produce 2*10 histograms for each mask (3 masks*10*2 histograms in an image). Due to the variation in dynamic range of the two axes and harmonics, we use data-dependent histogram ranges with 15 bins per histogram. We use the histogram frequencies as features for our image classification.
Figure 8
Figure 8
Evaluation of classification performance using nested cross-validation (CV). Internal cross-validation (CV) estimates optimal classifier model parameters over three folds and 10 iterations. The parameters optimized include SVM kernel, SVM cost, number of features and number of harmonics. External CV evaluates the optimal model by classifying independent samples.
Figure 9
Figure 9
A multi-class hierarchy of binary renal tumor subtype classifiers, also known as a directed acyclic graph (DAG) classifier. The overall accuracy of the DAG classifier can be optimized by independently optimizing each binary comparison.
Figure 10
Figure 10
Cross-validation estimates the prediction performance of shape-based classification models on independent samples. Scatter plot of inner CV vs. external CV average validation accuracy values over 10 external CV iterations for six pair-wise renal tumor subtype comparisons: CH vs. CC, CH vs. ON, CH vs. PA, CC vs. ON, CC vs. PA, and ON vs. PA. The plotted performance value for each iteration is the average performance over three folds (for external CV) or over 10 iterations and three folds (for internal CV). The optimal classifier model parameters (one set for each point) are selected in the inner CV from a possible set of 72576 models consisting of 36 feature sizes, 14 types of classifiers (linear SVM and radial basis SVM classifiers with 13 different gammas), 16 cost values and 9 harmonic numbers.
Figure 11
Figure 11
Renal tumor binary classification models use a variety of features to quantify important biological properties. Percentage contribution of different features for each binary comparison in ‘All’ features model. The contribution of shape features tends to be greater than 55% for all endpoints (median value, marked by horizontal line).
Figure 12
Figure 12
The top discriminating shapes for six binary endpoints correspond to pathologically significant shapes in histological renal tumor images. We identify the top 25 features selected for each binary comparison and highlight all shapes in the images that have any Fourier shape-descriptor axes lengths corresponding to these top features. We selectively color the shapes based on “over expression” or increased relative frequency for particular subtypes. Green shapes: occur more frequently in clear cell; yellow shapes: occur more frequently in papillary; blue shapes: occur more frequently in chromophobe; and black shapes: occur more frequently in oncocytoma.

References

    1. Siegel R, Ward E, Brawley O, Jemal A. Cancer statistics, 2011. CA Cancer J Clin. 2011;61(4):212–236. doi: 10.3322/caac.20121. - DOI - PubMed
    1. Teloken PE, Thompson RH, Tickoo SK, Cronin A, Savage C, Reuter VE, Russo P. Prognostic Impact of Histological Subtype on Surgically Treated Localized Renal Cell Carcinoma. J Urol. 2009;182(5):2132–2136. doi: 10.1016/j.juro.2009.07.019. - DOI - PMC - PubMed
    1. Eble J, Sauter G, Epstein J, Sesterhenn I. Pathology and genetics of tumours of the urinary system and male genital organs. Lyon: IARC press Lyon; 2004.
    1. Demir C, Yener B. Automated cancer diagnosis based on histopathological images: a systematic survey. Tech Rep: Rensselaer Polytechnic Institute; 2005.
    1. Gurcan MN, Boucheron LE, Can A, Madabhushi A, Rajpoot NM, Yener B. Histopathological image analysis: A review. Biomed Eng, IEEE Rev. 2009;2:147–171. - PMC - PubMed

Publication types

LinkOut - more resources