. 2013 Mar 6;3(1):6.
doi: 10.1186/2044-5040-3-6.

Differential response of skeletal muscles to mTORC1 signaling during atrophy and hypertrophy

Affiliations

Differential response of skeletal muscles to mTORC1 signaling during atrophy and hypertrophy

C Florian Bentzinger et al. Skelet Muscle. .

Abstract

Background: Skeletal muscle mass is determined by the balance between protein synthesis and degradation. Mammalian target of rapamycin complex 1 (mTORC1) is a master regulator of protein translation and has been implicated in the control of muscle mass. Inactivation of mTORC1 by skeletal muscle-specific deletion of its obligatory component raptor results in smaller muscles and a lethal dystrophy. Moreover, raptor-deficient muscles are less oxidative through changes in the expression PGC-1α, a critical determinant of mitochondrial biogenesis. These results suggest that activation of mTORC1 might be beneficial to skeletal muscle by providing resistance to muscle atrophy and increasing oxidative function. Here, we tested this hypothesis by deletion of the mTORC1 inhibitor tuberous sclerosis complex (TSC) in muscle fibers.

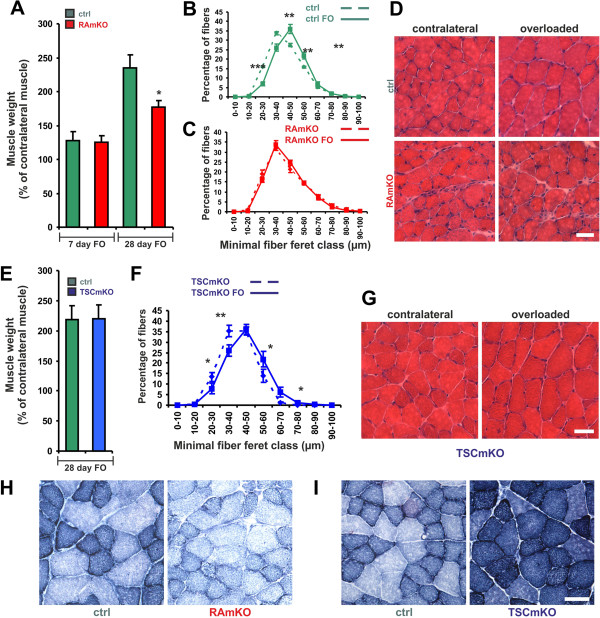
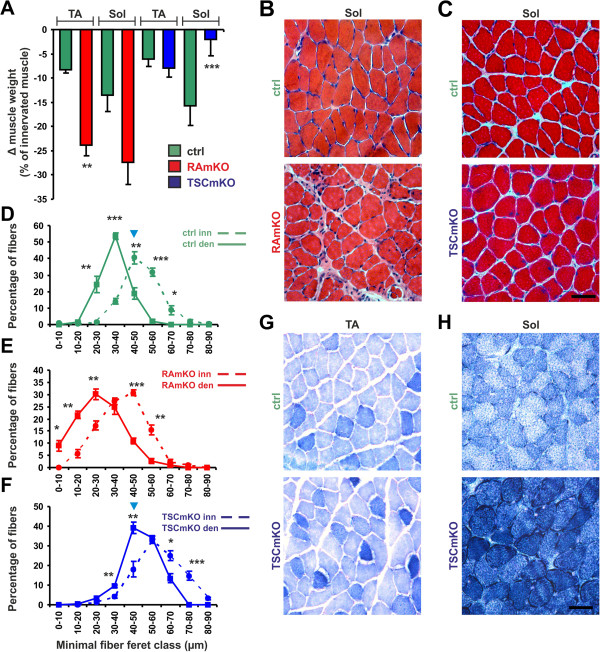
Method: Skeletal muscles of mice with an acute or a permanent deletion of raptor or TSC1 were examined using histological, biochemical and molecular biological methods. Response of the muscles to changes in mechanical load and nerve input was investigated by ablation of synergistic muscles or by denervation .

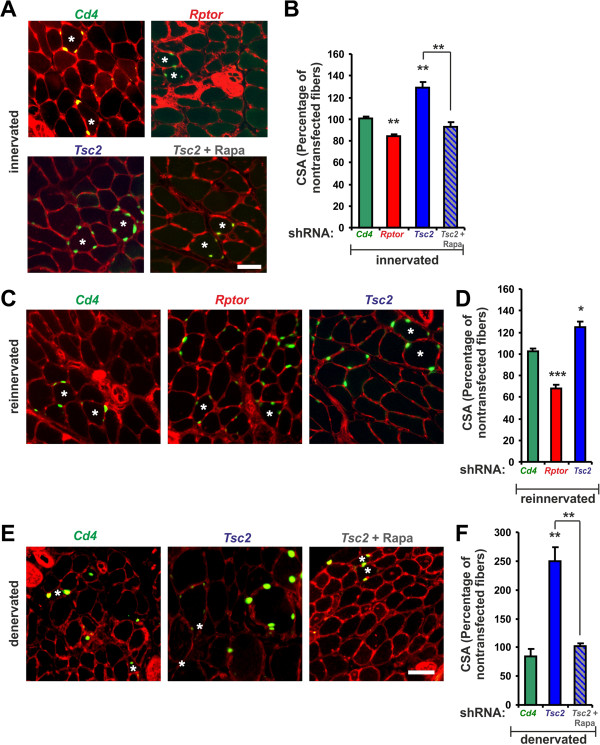
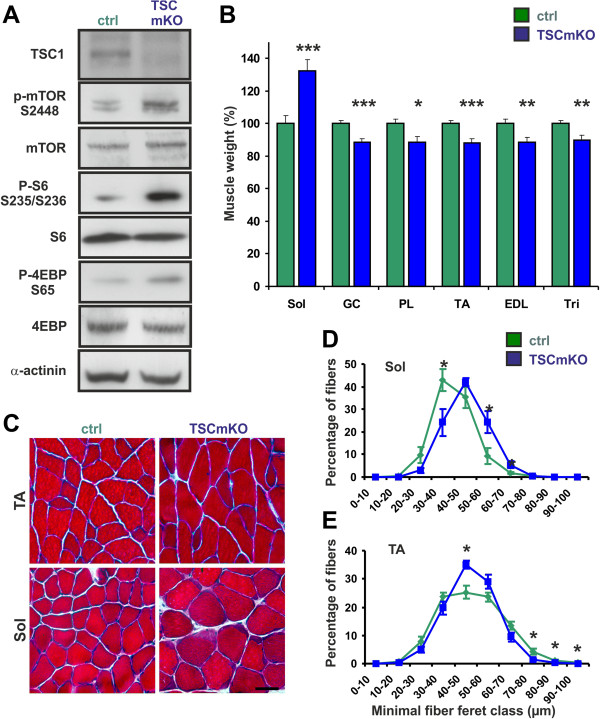
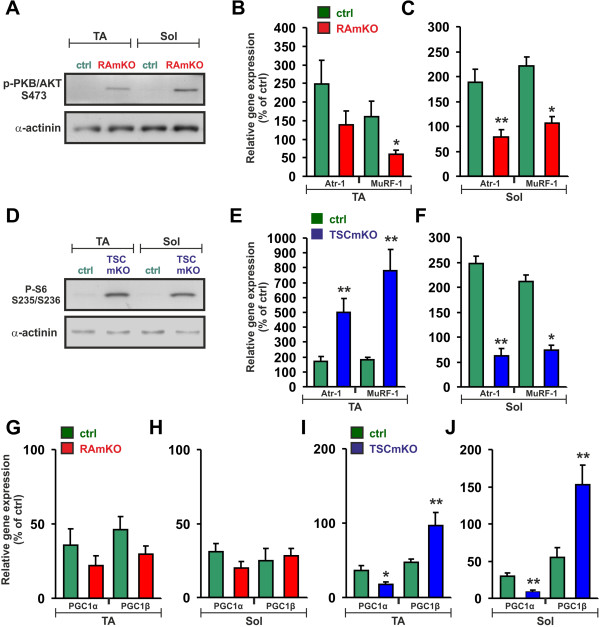
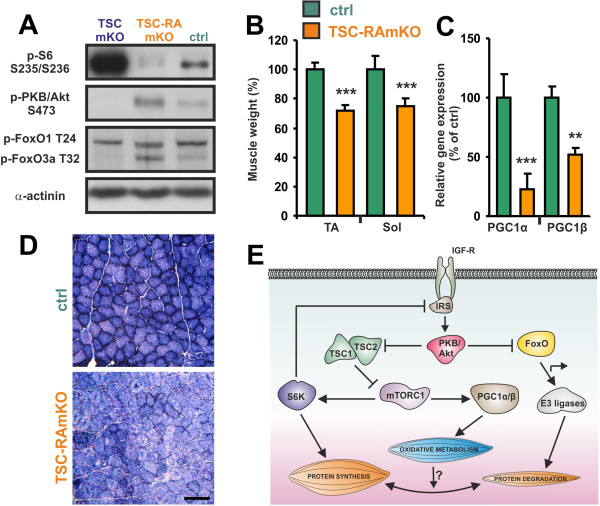
Results: Genetic deletion or knockdown of raptor, causing inactivation of mTORC1, was sufficient to prevent muscle growth and enhance muscle atrophy. Conversely, short-term activation of mTORC1 by knockdown of TSC induced muscle fiber hypertrophy and atrophy-resistance upon denervation, in both fast tibialis anterior (TA) and slow soleus muscles. Surprisingly, however, sustained activation of mTORC1 by genetic deletion of Tsc1 caused muscle atrophy in all but soleus muscles. In contrast, oxidative capacity was increased in all muscles examined. Consistently, TSC1-deficient soleus muscle was atrophy-resistant whereas TA underwent normal atrophy upon denervation. Moreover, upon overloading, plantaris muscle did not display enhanced hypertrophy compared to controls. Biochemical analysis indicated that the atrophy response of muscles was based on the suppressed phosphorylation of PKB/Akt via feedback inhibition by mTORC1 and subsequent increased expression of the E3 ubiquitin ligases MuRF1 and atrogin-1/MAFbx. In contrast, expression of both E3 ligases was not increased in soleus muscle suggesting the presence of compensatory mechanisms in this muscle.

Conclusions: Our study shows that the mTORC1- and the PKB/Akt-FoxO pathways are tightly interconnected and differentially regulated depending on the muscle type. These results indicate that long-term activation of the mTORC1 signaling axis is not a therapeutic option to promote muscle growth because of its strong feedback induction of the E3 ubiquitin ligases involved in protein degradation.


Figures

Figure 1
Figure 1
Acute perturbation of mTORC1 affects muscle fiber size.Soleus muscle was electroporated with plasmids encoding shRNA directed to transcripts encoding CD4 (Cd4), raptor (Rptor) or TSC2 (Tsc2). Plasmids encoding NLS-GFP were co-electroporated to label transfected fibers. After four to six weeks, muscle fiber size was determined by staining mid-belly cross-sections with Alexa-594-labeled wheat germ agglutinin (red). Transfected muscle fibers were identified by the expression of nuclear-localized GFP (green; white asterisks). The experimental paradigms used were innervated muscle (A, B), reinnervated muscle after nerve crush (C, D) and denervated muscle (E, F). Quantifications (B, D, F) of cross-sectional area (CSA) of muscle fibers in each paradigm are given relative to CSA of neighboring, GFP-negative, non-electroporated fibers. Electroporation of plasmids encoding shRNA to Cd4 served as control. Scale bars (A, C, E) = 50 μm. Bars (B, D, F) represent mean ± SEM (N ≥3 mice and N ≥200 fibers were measured in each). In case of innervated muscles treated with shRNA to Tsc2 and with rapamycin (Tsc2 + Rapa) and denervated muscles electroporated with shRNA to Cd4, data represent mean ± SD (N = 2). P-values are ***P <0.001; **P <0.01; *P <0.05. Unless otherwise indicated, significance was determined compared to the control (shRNA to Cd4).
Figure 2
Figure 2
Conditional inactivation of TSC1 in skeletal muscle. (A) Western blot analysis of soleus muscle from 90-day-old control (ctrl) and TSCmKO mice using antibodies directed against the proteins indicated. α-actinin is used as a loading control. (B) Weight of soleus (Sol), gastrocnemius (GC), plantaris (PL), tibialis anterior (TA), extensor digitorum longus (EDL) and triceps (Tri) muscles of TSCmKO and littermate control (ctrl) mice. Weight is expressed as a percentage of the weight of the same muscle in control mice after normalization to the total body weight (N = 8 to 12 mice for each genotype). Data are mean ± SEM; ***P <0.001; **P <0.01; *P <0.05; Student’s t-test. (C) H&E staining of cross-sections from TA and soleus muscles of control and TSCmKO mice. Scale bar = 50 μm. (D, E) Fiber size distribution in soleus (D) and TA (E) muscles of 90-day-old TSCmKO and control mice (N = 4). More details of fiber size analysis are shown in Additional file 1: Figure S3 and in Additional file 1, Table S1. *P <0.05.
Figure 3
Figure 3
mTORC1 activation affects the PKB/Akt and PGC1 pathways. (A) Western blot analysis of soleus muscles from 90-day-old control (ctrl) and TSCmKO mice using antibodies directed against the proteins indicated. α-actinin is used as loading control. (B, C) Relative mRNA expression of atrogin-1/MAFbx (Atr-1) and MuRF1 in TA and soleus muscles of TSCmKO and control mice. All values were normalized to the expression of β-actin and control muscles were set to 100% (TA: N ≥4 mice; Sol: N ≥5 mice). (D, E) Relative mRNA expression of Pgc1α and Pgc1β is shown in TA (D) and soleus (E) muscles of TSCmKO and control mice. All values are normalized to expression of β-actin. Relative expression in muscles from control littermates were set to 100%. TA: N ≥4; Sol: N ≥5. Note that levels of Pgc1β but not Pgc1α are up-regulated in TSCmKO mice. (F) Relative mRNA levels of Pgc1α in differentiated C2C12 cells that were infected with adenoviral vectors encoding GFP (ad-GFP), PGC1β (ad-PGC1β), shRNA to a scrambled sequence (ad-siScr) or shRNA to Pgc1β (ad-siPGC1β). Values are normalized to each control (ad-GFP and ad-siScr) and were set to 100% (N = 9). Note that expression of Pgc1α inversely correlates with PGC1β levels. Quantitative data (B-F) represent mean ± SEM. P-values are ***P <0.001; **P <0.01; *P <0.05; Student’s t-test. (G) NADH-TR staining of TA and soleus muscles of 90-day-old control and TSCmKO mice. Both muscles of TSCmKO are more oxidative. Scale bar = 50 μm.
Figure 4
Figure 4
Growth of muscle upon functional overloading. (A) Plantaris muscles of control (ctrl) and RAmKO mice were functionally overloaded (FO) by ablation of the soleus and gastrocnemius muscles. Muscle weight of plantaris was measured after 7 or 28 days of FO and is expressed as the percentage of the weight of the contralateral, non-overloaded muscle (7 days FO: N ≥5 mice; 28 days FO: N ≥7 mice). (B, C) Fiber size distribution of the contralateral (dashed line) and FO (closed line) plantaris muscle of control (B) and RAmKO (C) mice after 28 days of FO (N = 7). (D) H&E staining of overloaded and contralateral plantaris muscles after FO for 28 days in control and RAmKO mice. (E) Muscle weight after 28 days of FO in control and TSCmKO mice (N = 5). (F) Fiber size distribution of non-overloaded, contralateral (dashed line) and over-loaded plantaris muscles (solid line) after 28 days of FO in TSCmKO mice (N = 5). (G) H&E staining of overloaded and contralateral plantaris muscles after 28 days of FO from TSCmKO mice. (H, I) NADH-TR staining of plantaris muscles after 28 days FO in mice with the indicated genotype. Scale bars (D, G, H, I) = 50 μm. Individual data points and bars of quantitative data represent mean ± SEM. P-values are ***P <0.001; **P <0.01; *P <0.05; Student’s t-test.
Figure 5
Figure 5
Muscle atrophy induced by denervation. (A) Loss (Δ) of muscle weight in tibialis anterior (TA) and soleus (Sol) muscles after six days of denervation using mice of the indicated genotype. Data are expressed as percentage of weight loss compared to the non-denervated contralateral muscle in the same mouse. N ≥4 mice for RAmKO and control littermates (ctrl); N ≥5 mice for TSCmKO and control littermates. (B, C) H&E staining of soleus muscle after six days of denervation in mice of the indicated genotype. (D-F) Fiber size distribution in soleus muscle after six days of denervation (solid line) and in the contralateral, non-denervated muscle (dashed line) of mice with the indicated genotype. Note that the most frequent fiber size in the denervated TSCmKO muscle is the same as that of innervated control muscle (blue arrowheads). N ≥4 for RAmKO and control littermates; N = 5 for TSCmKO and control littermates. (G, H) NADH-TR staining of TA and soleus muscles after six days of denervation in control and TSCmKO mice. Scale bars (B, C, G, H) = 50 μm. Quantification represent mean ± SEM. P-values are ***P <0.001; **P <0.01; *P <0.05 using the Student’s t-test.
Figure 6
Figure 6
Changes in mTORC1-dependent signaling in denervated muscles. (A, D) Western blot analysis of tibialis anterior (TA) and soleus (Sol) muscles after six days of denervation using antibodies against PKB/Akt phosphorylated at Serine 473 (A) and S6 phosphorylated at Serines 235/236 (D). α-actinin was used as a loading control. (B, C, E, F) Relative mRNA levels of atrogin-1/MAFbx (Atr-1) and MuRF1 as determined by qPCR in TA and soleus (Sol) muscles after six days of denervation. Note that expression of both E3 ligases is blunted in RAmKO mice (B, C), while this response is exaggerated in TA (E) but not in soleus muscles (F) of TSCmKO mice. (G – J) Relative mRNA levels of Pgc1α and Pgc1β in RAmKO (G, H) and TSCmKO (I, J) mice after six days of denervation. All values are normalized to the expression levels of the transcript measured in innervated muscle of control littermates (set to 100%). N ≥4 mice for TA and N ≥5 mice for soleus of each genotype. Values represent mean ± SEM. P-values are ***P <0.001; **P <0.01; *P <0.05; Student’s t-test.
Figure 7
Figure 7
TSC1-raptor double knockouts resemble RAmKO mice. (A) Western blot analysis of soleus muscles of TSCmKO, TSC-RAmKO and control (ctrl) mice using antibodies directed against the proteins indicated. An equal amount of protein was loaded in each lane. Loading control was α-actinin. (B) Muscle weight of the tibialis anterior (TA) and soleus (Sol) muscles of TSC-RAmKO and control mice. Muscle weight was first normalized to the body weight and is expressed as percentage of the weight of the same muscle from control mice (N = 3 mice for each genotype). (C) Relative mRNA expression of Pgc1α and Pgc1β in soleus muscle of TSC-RAmKO and ctrl mice. Values obtained in control mice were set to 100% (N = 3 mice). Bars in B and C represent mean ± SEM. P-values are ***P <0.001; **P <0.01; *P <0.05. (D) NADH-TR staining of soleus muscle from TSC-RAmKO and control mice. Scale bar = 100 μm. (E) Schematic drawing of the major signaling pathways regulated by mTORC1 and their influence on protein synthesis and degradation.

References

    1. Sandri M. Signaling in muscle atrophy and hypertrophy. Physiology (Bethesda) 2008;23:160–170. doi: 10.1152/physiol.00041.2007. - DOI - PubMed
    1. Ruegg MA, Glass DJ. Molecular mechanisms and treatment options for muscle wasting diseases. Annu Rev Pharmacol Toxicol. 2011;51:373–395. doi: 10.1146/annurev-pharmtox-010510-100537. - DOI - PubMed
    1. Wullschleger S, Loewith R, Hall MN. TOR signaling in growth and metabolism. Cell. 2006;124:471–484. doi: 10.1016/j.cell.2006.01.016. - DOI - PubMed
    1. Laplante M, Sabatini DM. mTOR signaling in growth control and disease. Cell. 2012;149:274–293. doi: 10.1016/j.cell.2012.03.017. - DOI - PMC - PubMed
    1. Bodine SC, Stitt TN, Gonzalez M, Kline WO, Stover GL, Bauerlein R, Zlotchenko E, Scrimgeour A, Lawrence JC, Glass DJ, Yancopoulos GD. Akt/mTOR pathway is a crucial regulator of skeletal muscle hypertrophy and can prevent muscle atrophy in vivo. Nat Cell Biol. 2001;3:1014–1019. doi: 10.1038/ncb1101-1014. - DOI - PubMed