. 2013 Mar 12;14(3):R21.
doi: 10.1186/gb-2013-14-3-r21.

DNA methylation of distal regulatory sites characterizes dysregulation of cancer genes

DNA methylation of distal regulatory sites characterizes dysregulation of cancer genes

Dvir Aran et al. Genome Biol. .

Abstract

Background: Abnormal epigenetic marking is well documented in gene promoters of cancer cells, but the study of distal regulatory siteshas lagged behind.We performed a systematic analysis of DNA methylation sites connected with gene expression profilesacross normal and cancerous human genomes.

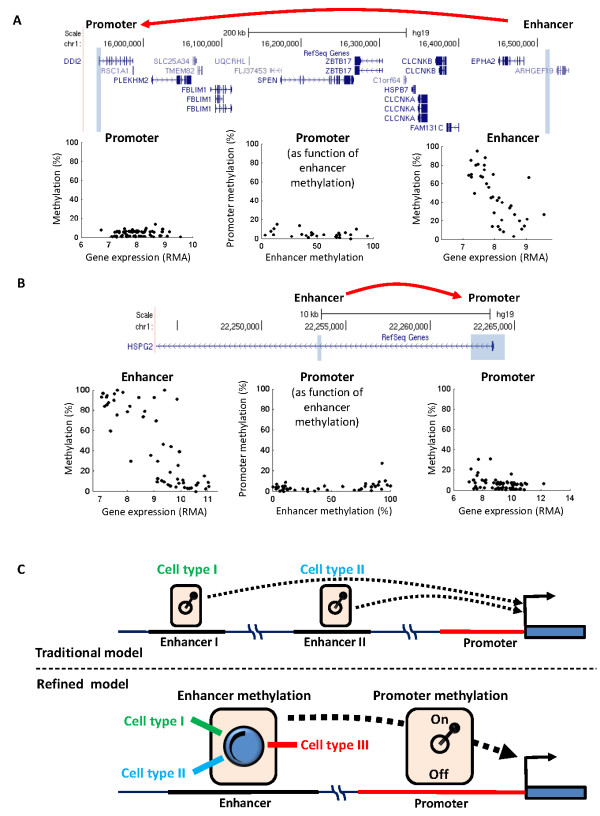
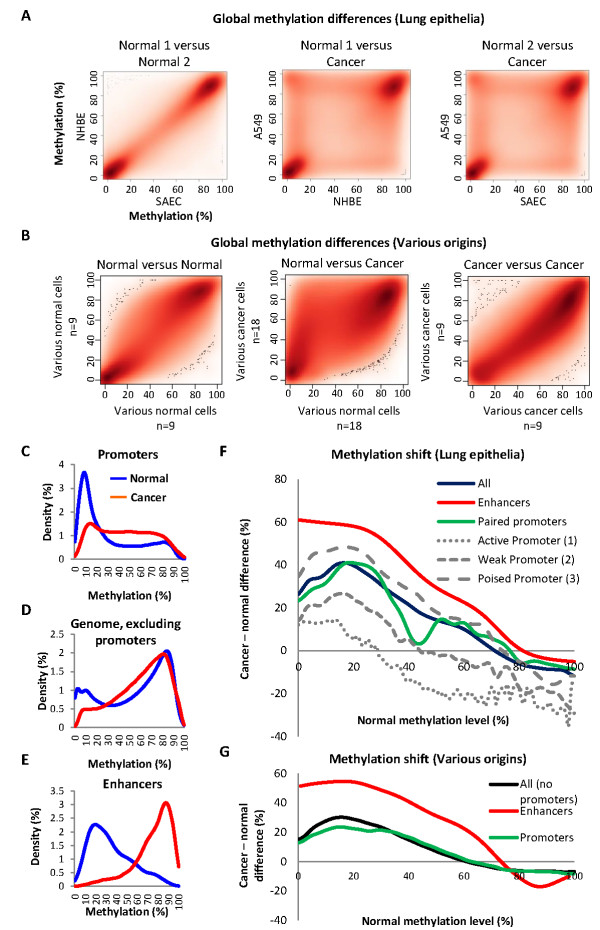
Results: Utilizing methylation and expression data in 58 cell types, we developed a model for methylation-expression relationships in gene promoters and extrapolated it to the genome. We mapped numerous sites at which DNA methylation was associated with expression of distal genes. These sites bind transcription factors in a methylation-dependent manner, and carry the chromatin marks of a particular class of transcriptional enhancers. In contrast to the traditional model of one enhancer site per cell type, we found that single enhancer sites may define gradients of expression levels across many different cell types. Strikingly, the identified sites were drastically altered in cancers: hypomethylated enhancer sites associated with upregulation of cancer-related genes and hypermethylated sites with downregulation. Moreover, the association between enhancer methylation and gene deregulation in cancerwas significantly stronger than the association of promoter methylationwith gene deregulation.

Conclusions: Methylation of distal regulatory sites is closely related to gene expression levels across the genome. Single enhancers may modulate ranges of cell-specific transcription levels, from constantlyopen promoters. In contrast to the remote relationships between promoter methylation and gene dysregulation in cancer, altered methylation of enhancer sites is closely related to gene expression profiles of transformed cells.


Figures

Figure 1
Figure 1
Promoter-based model of methylation-expression relationships at regulatory sites. (A) A typical gene-CpG sample pair, conveying the methylation of a promoter-based CpGsite in relation to the expression levels of its linked gene across cell types.(B) A machine-learning algorithm (SVM-MAP) was trained to distinguish true gene-CpG pairs out of 50-fold excess of false (randomized) pairs. Through rounds of training and test sets, the algorithm optimized parameters of linear (Pearson coefficient) and monotonic (Spearman) correlations to provide the best discrimination between true and false pairs, producing a general model for methylation-transcription relationships in gene promoters. Based on fitting with the learned model,a score was assigned to each gene-CpG pair. (C) Rates of successful gene-promoter pairing as a function of thresholds on the scores (null expectation = 50%). At score ≥0.85, the model successfully paired 87.2% ofthe genes to their actual promoters (dashed lines).
Figure 2
Figure 2
Mapping and validating distal regulatory sites using DNA methylation. (A)Mapping strategy: a model for methylation-expression relationships in gene promoters was applied to VMSs from 1 Mb upstream through 1 Mb downstream of 17,862 genes. (B)Distribution of methylation-versus-expression levels for high-scoring gene-CpG pairs (score ≥0.9, n = 2,824). (C)Relative enrichment of chromatin factors around the high-scoring methylation sites (n = 1,911), excluding sites in the promoters of the associated genes. Data were normalized to 0 to 1 scale.(D) Fold enrichment of methylation sites (n = 2,824) in actual gene intervals (real), versus the null expectation based on random permutations of gene expression data (random), of chromatin states defined by the ChromHMM algorithm [27].(E)Left: Number of transcription factors binding to the high-scoring sites, compared with random expectations. Right:Number of transcription factors binding to unmethylated or methylated enhancers, compared with random expectations. Averages of four cell types for which methylation and binding data were available (GM12878, HepG2, HeLaS3, K562) are shown.Sites in the promoters of the associated genes were excluded.(F) Evolutionary sequence conservation around the top-scoring sites. The analyses shown in D and E excluded all sites at ±5 kb from TSSs. TF, transcription factors.
Figure 3
Figure 3
Enhancer methylation defines gradients of cell-type transcription levels. (A)An example of gene-enhancer pair in the RSC1A1 gene region. Gray boxes mark an enhancer methylation site associated with expression of the RSC1A1 gene, and the promoter of this gene. The x-y scatters below the map show methylation versus expression across the cell types for the promoter methylation sites (left), and for the enhancer site (right). The middlescatter shows the methylation of the promoter sites versus methylation of the enhancer across the cell types. (B) Similar to A, but for an enhancer within the first intron of the HSGG2 gene, interacting with HSGG2expression. (C) Models for enhancer control of cell-type expression levels. Upper panel: The traditional model suggesting that enhancers act like cell-type-specific switches of gene transcription, each of them supports expression in a given cell type (or types). Bottom: A refined model suggesting that even a single enhancer site may functions as a dimmer switch, mediating gradients of transcription levels across many cell types as long as the promoter is unmethylated and thus permissive for transcription. RMA, (Robust Multi-chip Average).
Figure 4
Figure 4
Altered enhancer methylation predicts changes in the expression profiles of cancer genes. (A) Each of the x-y scatters shows the difference in gene expression between normal and cancer cells as a function of the difference in methylation levels (for example, a difference of +100 indicates that the given site was 0% methylated in the normal cells and 100% methylated in the cancer). The plots on the left are for high-scoring enhancer sites associate with 486 genes,the right plots show the promoters of 394(out of 486) genes that were associated with enhancers, and theplots in the middle show all promoters.Blue dots and clouds donate the frequencies of methylation-versus-expression differences. Linear regression (red lines) and Pearson coefficients (R values) are shown for each scatter. (B) Same as in A, but for the 505methylation sites (out of the 1,911) in state 4 enhancers. (C)Left:Overlap between the genes (score ≥0.85) in the upper-left quadrants (that is, genes thatwere upregulated by ≥0.25 expression units withdistal enhancers that were hypomethylated by ≥25%) in breast, lung, and the collection of 18 normal versus cancer cell types. The numbers of overlapping genes are indicated. Right: Examples of GO groups that significantly enriched among the 207 genes that were upregulated and hypomethylated in the various cancer types (the entire list is provided in Table S4 in Additional file 1).
Figure 5
Figure 5
Enhancer methylation maybe specifically altered in cancer. (A,B)x-y scatters showing the methylation of sites across the genome in a given cell type (or a collection of cell types) versus another cell type (or types).(A)Normal and cancerous lung epithelia: genome-wide methylation of normal versus normal (left) or of cancer versus normal (middle and right) cell types. The given cell types are indicated, as listed in table S2. (B) Normal and cancerous cell types of various tissue origins: genome-wide methylation of nine normal cell types of various tissue origins, versus another nine cell types (left), of 18 cancer versus 18 normal cell types (middle), or of nine cancers versus other cancers (right). (C-E) Distributions of methylation levels in the collection of normal and cancer samples shown in B, in promoter sites, in all sites excluding promoters, or in the high-scoring enhancer sites. (F) Average gain or loss of methylation in cancer, as a function of the methylation levelin normal cells: for any given level of methylation in the normal cells, the graph shows the average change in the cancer, according to the global trend shown in B. Data are shown for all sites; for sites in the high-scoring enhancers; for sites in the promoters paired with the high-scoring enhancers; or for sites in strong, weak or poised promoters. The analysis is based on methylation levels and chromatin states in human mammary epithelial cells and MCF7 cells shown in A. (G)Same analysis as in F, but for 18 normal and 18 cancer cell types shown in B.

References

    1. Klose RJ, Bird AP. Genomic DNA methylation: the mark and its mediators. Trends Biochem Sci. 2006;14(2):89–97. doi: 10.1016/j.tibs.2005.12.008. - DOI - PubMed
    1. Hellman A, Chess A. Gene body-specific methylation on the active × chromosome. Science. 2007;14(5815):1141–1143. doi: 10.1126/science.1136352. - DOI - PubMed
    1. Suzuki MM, Bird A. DNA methylation landscapes: provocative insights from epigenomics. Nat Rev Genet. 2008;14(6):465–476. doi: 10.1038/nrg2341. - DOI - PubMed
    1. Zemach A, McDaniel IE, Silva P, Zilberman D. Genome-wide evolutionary analysis of eukaryotic DNA methylation. Science. 2010;14(5980):916–919. doi: 10.1126/science.1186366. - DOI - PubMed
    1. Feng S, Cokus SJ, Zhang X, Chen PY, Bostick M, Goll MG, Hetzel J, Jain J, Strauss SH, Halpern ME, Ukomadu C, Sadler KC, Pradhan S, Pellegrini M, Jacobsen SE. Conservation and divergence of methylation patterning in plants and animals. Proc Natl Acad Sci USA. 2010;14(19):8689–8694. doi: 10.1073/pnas.1002720107. - DOI - PMC - PubMed

Publication types

MeSH terms