. 2013 May;1834(5):874-89.
doi: 10.1016/j.bbapap.2013.02.042. Epub 2013 Mar 14.

Functional site plasticity in domain superfamilies

Affiliations

Functional site plasticity in domain superfamilies

Benoit H Dessailly et al. Biochim Biophys Acta. 2013 May.

Abstract

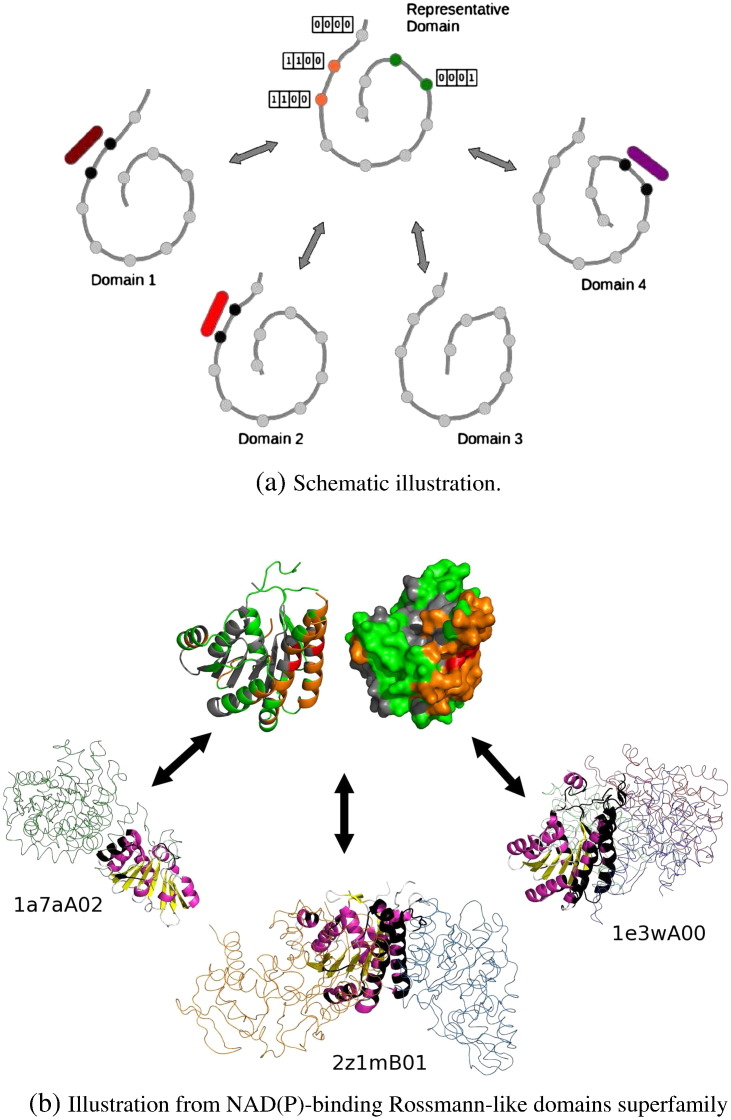
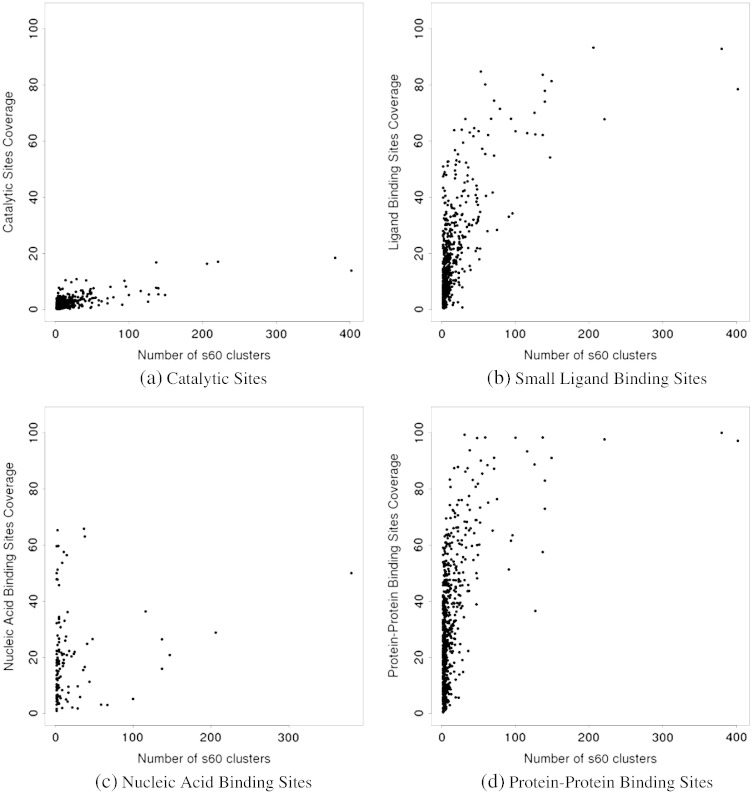
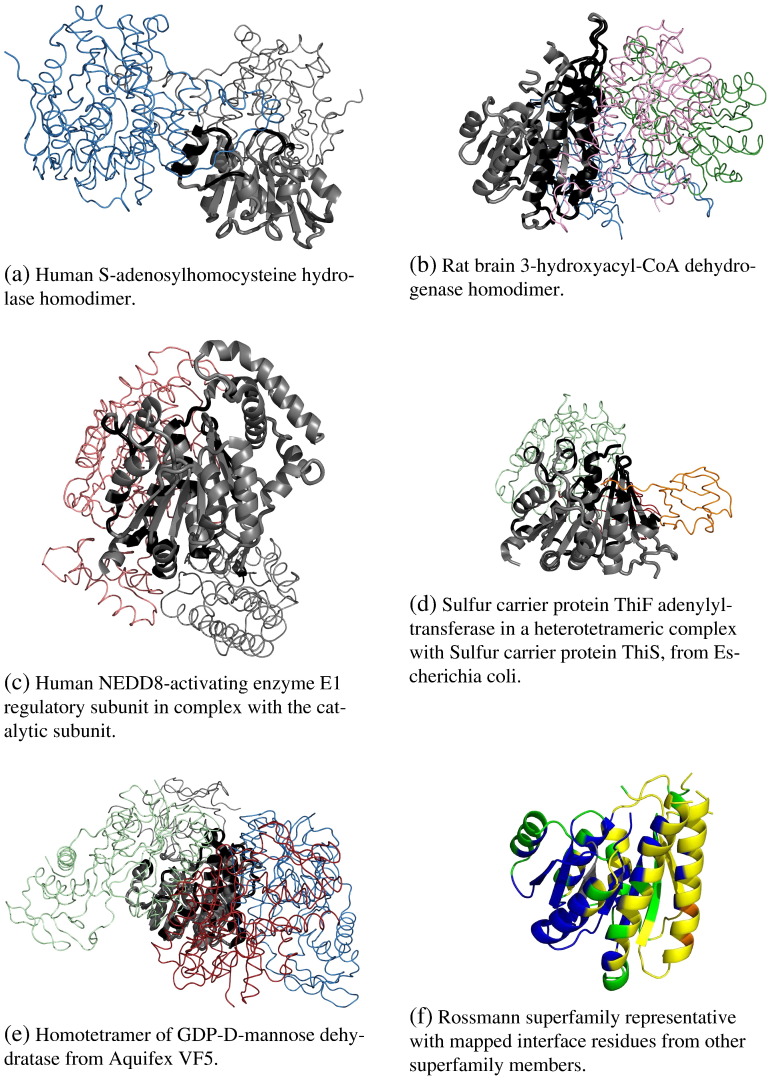
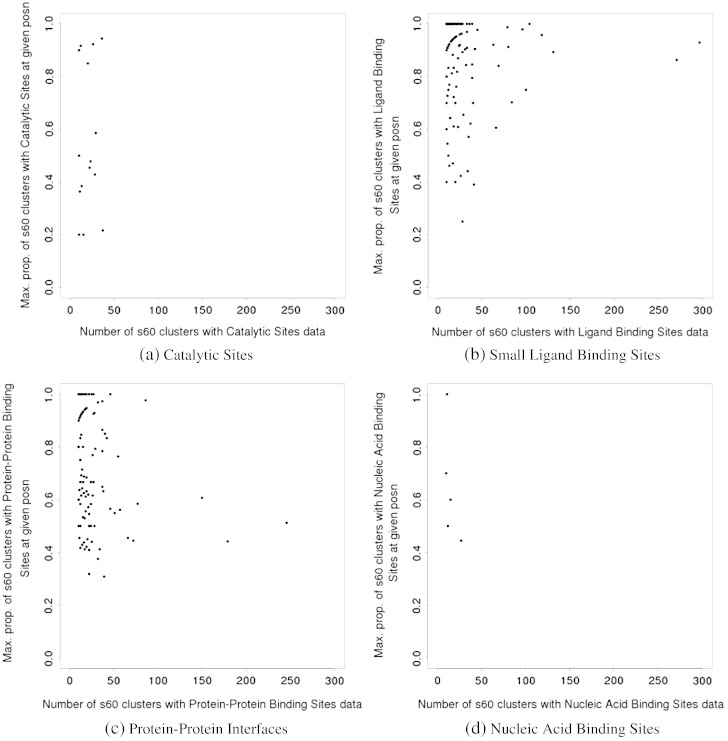
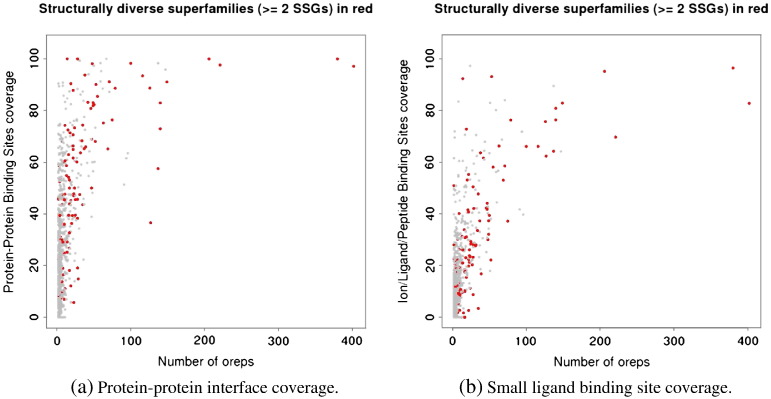
We present, to our knowledge, the first quantitative analysis of functional site diversity in homologous domain superfamilies. Different types of functional sites are considered separately. Our results show that most diverse superfamilies are very plastic in terms of the spatial location of their functional sites. This is especially true for protein-protein interfaces. In contrast, we confirm that catalytic sites typically occupy only a very small number of topological locations. Small-ligand binding sites are more diverse than expected, although in a more limited manner than protein-protein interfaces. In spite of the observed diversity, our results also confirm the previously reported preferential location of functional sites. We identify a subset of homologous domain superfamilies where diversity is particularly extreme, and discuss possible reasons for such plasticity, i.e. structural diversity. Our results do not contradict previous reports of preferential co-location of sites among homologues, but rather point at the importance of not ignoring other sites, especially in large and diverse superfamilies. Data on sites exploited by different relatives, within each well annotated domain superfamily, has been made accessible from the CATH website in order to highlight versatile superfamilies or superfamilies with highly preferential sites. This information is valuable for system biology and knowledge of any constraints on protein interactions could help in understanding the dynamic control of networks in which these proteins participate. The novelty of our work lies in the comprehensive nature of the analysis - we have used a significantly larger dataset than previous studies - and the fact that in many superfamilies we show that different parts of the domain surface are exploited by different relatives for ligand/protein interactions, particularly in superfamilies which are diverse in sequence and structure, an observation not previously reported on such a large scale. This article is part of a Special Issue entitled: The emerging dynamic view of proteins: Protein plasticity in allostery, evolution and self-assembly.


Figures

Fig. 1
Fig. 1
Mapping protocol. Fig. 1a illustrates the protocol schematically. All domains in a superfamily (domains 1 to 4) are structurally aligned to a superfamily representative. Domains are represented as a dark grey backbone, and individual residues are represented as beads along the backbone. Ligands are represented as purple, red and magenta ellipsoids that bind to domains 1, 2 and 4, respectively. Binding residues in these domains are coloured in black. Binding residues from the individual domains are then mapped to the representative, and the frequency with which representative residues map to binding residues is recorded. In this example, the residues in orange on the representative map to binding residues in two domains (domains 1 and 2), whereas the residues in green map to binding residues in only one domain (domain 4). The vectors next to some of the positions of the representative summarise the list of superfamily domains where equivalent residues are involved in binding. Fig. 1b illustrates the protocol with real protein-protein interface data from domains in the NAD(P)-binding Rossmann-like superfamily. Three individual domains from the superfamily are represented in complex with their protein partners at the bottom, and their interface residues are mapped on the representative at the top. The domains of interest are shown in cartoon whereas the partner chains are represented as thin linear chains. The representative is shown both in cartoon and surface representation. Binding residues in the individual domains are coloured black. Residues on the representative are coloured grey, green, orange or red depending on the number of individual domains that have a binding residue at that position (0, 1, 2 or 3).
Fig. 2
Fig. 2
Functional site coverage and sequence diversity of domain superfamilies. Each plot shows the data for a specific type of functional site. Each superfamily is represented as a dot in these plots. Functional site coverage on the Y-axis is measured as the proportion of residues in the representative that map to at least one site in any member of the superfamily. Superfamily diversity on the X-axis is measured as the number of clusters of sequences at 60% sequence identity in the superfamily.
Fig. 3
Fig. 3
Example of a small superfamily with limited coverage of protein-protein interfaces. This is the Bacterial GTP-ase Activating Protein (GAP) domain superfamily (CATH code 1.20.120.260). The GAP domain is always displayed in grey cartoon. In Fig. 3a and 3b, the interacting partner is coloured red and blue, respectively. Interface residues on the GAP domain are coloured black. Fig. 3a and 3b display PDB entries 1he1 and 1g4u1he11g4u, respectively. In Fig. 3c, the representative is displayed in grey cartoons. Residues that map to interface residues in superfamily members are coloured according to the percentage of members that have an interface residue at that position, using the following colour scale: 0 in grey, 1–20% in blue, 20–40% in green, 40–60% in yellow, 60–80% in orange and 80–100% in red).
Fig. 4
Fig. 4
Example of a large and diverse superfamily with limited coverage of protein-protein interfaces. This is the “Two-Dinucleotide Binding Domains” Flavoprotein (tDBDF) superfamily (CATH code 3.50.50.60). The tDBDF domain is always displayed in grey cartoon. In Fig. 4a (PDB entry 1jnr) and 4b (PDB entry 1kf6), the interacting partners are represented as coloured traces. Interface residues on the tDBDF domain are coloured black. The interface occurs in a similar location in these two distinct domains. Fig. 4c shows the representative with residues coloured according to the fraction of superfamily members that have an interface residue at that position, following the same colour scheme as described at Fig. 3.
Fig. 5
Fig. 5
Example of a large and diverse superfamily with large coverage of protein-protein interfaces. This is the NAD(P)-binding Rossmann superfamily (CATH code.40.50.720). The Rossmann domain is always displayed in grey cartoon and shown in the same orientation. Extra-domains from the same chain are displayed as grey traces. Interacting partners are displayed as coloured traces. Interface residues on the Rossmann domain are coloured black. Fig. 5a through to 5e display PDB entries 1a7a, 1e3w, 1tt5, 1zud, and 2z1m, respectively. Fig. 5f shows the representative with residues coloured according to the same colour scheme as described at Fig. 3.
Fig. 6
Fig. 6
Preferential location of functional sites in CATH superfamilies. Each dot represents a superfamily. The plots show, on the Y-axis, the maximum proportion of 60% sequence identity clusters that have a functional site at a given position (or, in other words, it shows the proportion of 60% seq. id. clusters with a functional site at the position where that proportion is the highest). The X-axis shows the number of 60% seq. id. clusters that have functional site data of that type in the superfamily. Only superfamilies with at least 10 60% seq. id. clusters are considered here. This is to avoid meaningless fractions on the Y-axis (50% of 2 clusters is only one cluster).
Fig. 7
Fig. 7
Protein-protein interface coverage for 10 most populated superfamilies in the CATH database. The colour scheme is the same as in Fig. 3.
Fig. 8
Fig. 8
Functional site coverage versus superfamily diversity, with structurally diverse superfamilies coloured in red. Superfamilies are defined as structurally diverse if they contain at least 2 structural clusters (see Methods section).
Fig. 9
Fig. 9
Comparison of the number of catalytic residues that are conserved in each type of functional family, before and after removing fragments.

References

    1. Ezkurdia L. Bartoli, Fariselli P., Casadio R., Valencia A., Tress M.L. Progress and challenges in predicting protein–protein interaction sites. Brief. Bioinform. 2009;10(3):233–246. - PubMed
    1. Aloy P., Ceulemans H., Stark A., Russell R.B. The relationship between sequence and interaction divergence in proteins. J. Mol. Biol. 2003;332:989–998. - PubMed
    1. López G., Valencia A., Tress M.L. firestar—prediction of functionally important residues using structural templates and alignment reliability. Nucleic Acids Res. 2007;35 (Web Server issue) - PMC - PubMed
    1. Roy A., Kucukural A., Zhang Y. I-TASSER: a unified platform for automated protein structure and function prediction. Nat. Protoc. 2010;5(4):725–738. - PMC - PubMed
    1. Roy A., Zhang Y. Recognizing protein-ligand binding sites by global structural alignment and local geometry refinement. Structure. 2012;20(6):987–997. (London, England: 1993) - PMC - PubMed

Publication types

LinkOut - more resources