Review
. 2013 Jul:35:63-81.
doi: 10.1016/j.preteyeres.2013.01.005. Epub 2013 Mar 15.

Adaptation of the central retina for high acuity vision: cones, the fovea and the avascular zone

Affiliations
Review

Adaptation of the central retina for high acuity vision: cones, the fovea and the avascular zone

Jan M Provis et al. Prog Retin Eye Res. 2013 Jul.

Abstract

Presence of a fovea centralis is directly linked to molecular specification of an avascular area in central retina, before the fovea (or 'pit') begins to form. Modelling suggests that mechanical forces, generated within the eye, initiate formation of a pit within the avascular area, and its later remodelling in the postnatal period. Within the avascular area the retina is dominated by 'midget' circuitry, in which signals are transferred from a single cone to a single bipolar cell, then a single ganglion cell. Thus in inner, central retina there are relatively few lateral connections between neurons. This renders the region adaptable to tangential forces, that translocate of ganglion cells laterally/centrifugally, to form the fovea. Optical coherence tomography enables live imaging of the retina, and shows that there is greater variation in the morphology of foveae in humans than previously thought. This variation is associated with differences in size of the avascular area and appears to be genetically based, but can be modified by environmental factors, including prematurity. Even when the fovea is absent (foveal hypoplasia), cones in central retina adopt an elongated and narrow morphology, enabling them to pack more densely to increase the sampling rate, and to act as more effective waveguides. Given these findings, what then is the adaptive advantage of a fovea? We suggest that the advantages of having a pit in central retina are relatively few, and minor, but together work to enhance acuity.


Figures

Figure 1
Figure 1
Vascular and neuronal adaptations at the area centralis of the cat retina, and at the fovea centralis of the human retina. A: The image shows the appearance of the retinal vasculature at the area centralis of the cat retina. The map shows ganglion cell isodensity lines in the cat retina (/mm2) Adapted, with permission http://www.retinalmaps.com.au/. Retinal vessels converge on the area centralis (star) which is supplied by a network of capillaries; large diameter vessels do not cross the specialized area, where peak is ganglion cell density ~8K cells/mm2. B: The image shows the arrangement of vessels at the fovea centralis of the human retina (courtesy of Prof Dao-Yi Yu, University of Western Australia). Large vessels converge on the foveal avascular zone (centre), and give rise to a dense microvascular network that supplies the macular region. The map shows the ganglion cell topography in a human retina. While ganglion cells are absent from the central fovea (corresponding with with the avascular area), they reach a maximum density of ~35K/mm2 on the foveal rim (see Curcio & Allen (1990) J. Comp. Neurol.). The shading indicates the region where ganglion cell density is elevated, resulting in a `visual streak'-like feature in the retina (adapted from Stone and Johnson (1981) J. Comp. Neurol.).
Figure 2
Figure 2
Relative levels of expression of 3 guidance factors in the macula of macaque monkey retina during prenatal and early postnatal development. Both Netrin G1 and Unc-5h4 mRNAs tend to be uniformly distributed across the retina in late development and post-natal. However, expression of EphA6 continues to rise at the macula after birth (~174 dPC), suggesting that it may be playing a role in defining synaptic territories in the brain in the postnatal period.
Figure 3
Figure 3
Representative examples from the semi-quantitative analyses of retinal cell densities in primate retinas (redrawn and modified from Figures 1, 3 and 4 of Rohen & Castenholz (1967)). Five standard retinal sample locations are indicated in the upper drawings. Retinal thickness is represented in the lower diagrams by horizontal bars, drawn to scale (bottom of the diagram). The thickness of each layer, and the lengths of the inner and outer segments, is indicated by the striped segments, at the right-hand end of each histogram; black bands indicate the thickness of the cellular layers (outer nuclear (ONL), inner nuclear (INL) and ganglion cell layers (GCL), from right to left); white bands represent the intervening plexiform layers, and the nerve fibre layer (left-hand end of each histogram). The numbers show the ratios of cells in the cell layers at each location (GC:INL:ONL). The illustration shows that in all cases, the photoreceptors at the posterior pole are significantly elongated compared to the periphery. In Galego senegalensis, the photoreceptors in the area centralis (location 3) are almost twice the length of photoreceptor segments in the periphery. The data indicate that a fovea is not required to generate photoreceptor elongation, and hence packing, of central photoreceptors.
Figure 4
Figure 4
Fibroblast growth factor (FGF)-2 and FGF receptor (R)1, R3 and R4 mRNA expression during morphological development of cones. A: The changing morphology of foveal cones during fetal life, compared with an adult cone is shown including the typical distribution of three FGFRs at four different stages (adapted from Hendrickson, 1984). B: Histograms showing the levels of expression of the morphogenetic growth factor, FGF2 by cones 3 retinal locations at 5 timepoints. The locations are numbered for comparison with Fig 3 – `4', Fovea; `5' Parafovea; `2', Posterior pole (nasal side). The data show that FGF2 is expressed at high levels in foveal cones before (95dPC) and after (4mo postnatal) formation of the fovea, but not during (105dPC to birth). Asterisks indicate a significant difference in the level of FGF2 expressed. During early formation of the fovea, in utero, cones are slow to elongate and have low levels of FGF2 mRNA. After birth they elongate rapidly, and express high levels of FGF2. C: Section through a macaque fovea at 150dPC, indicating the 3 locations (4, 5 and 2) where FGF2 expression was measured, to generate the histograms. Note that cones on the edge of the fovea (5), which express high levels of FGF2, are considerably more elongated than those in the central fovea, which express significantly lower levels of FGF2. INL, inner nuclear layer; GCL, ganglion cell layer; p/r photoreceptors; dPC days post conception.
Figure 5
Figure 5
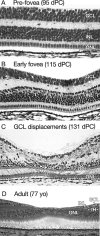
Excavation of the fovea during development(macaque, A–C), and in the mature fovea in a 77 year old human donor (D). A: Before the fovea forms, the location of the future fovea can be identified by the predominance of cones, seen as a single layer of cuboidal cells in the ONL. The GCL comprises many layers of ganglion cell bodies. B. In the very early fovea the GCL is thinner than at 95 dPC, but the depth of the other retinal layers is virtually unchanged. C: Ganglion cells are displaced from the early fovea very quickly, so that within a short period of time the GCL comprises only one layer of cells, as seen here. Morphological evidence of displacement includes the outward angling of the axons of cones forming the layer of Henle fibres, except those in the fovea. In addition, processes of bipolar cells can be seen obliquely crossing the transient layer of Chievitz (*), to synapse on their target ganglion cells that have been centrifugally displaced. D. In the adult fovea there are very few ganglion cells present centrally, and cone cell bodies lie close to the surface of the retina. The elongated inner and outer segments constitute more than 50% of the retinal thickness within the fovea. INL, inner nuclear layer; IPL, inner plexiform layer; fH, fibres of Henle; GCL, ganglion cell layer; ONL, outer nuclear layer; OPL, outer plexiform layer; p/r photoreceptors; dPC days post conception. Scale bars represent 50 μm.
Figure 6
Figure 6
Diagrammatic representation of four stages in development of the fovea. Ages are an approximate indication of stages of human development. Cones are shown in red, rods in grey, bipolar cells in blue, amacrine cells in pink, and ganglion cells in yellow. The relationships between cells in the different layers approximates the midget circuits in the retina. Red lines represent the approximate arrangements of the retinal vessels. A: Indicating the appearance of the central macula just prior to the early appearance of the fovea. Retinal vessels are present only in the GCL, and the GCL comprises several layers of cells. At this stage cells in all layers tend to crowd toward the incipient fovea (centripetal displacement), as indicated by the large grey arrows. Photoreceptors on the edge of the foveal cone mosaic (where rods are absent) are more elongated than those in the centre. B: Once the FAZ is defined, the inner surface of the retina within the FAZ is deformed, forming a shallow depression, which is the first indication of formation of the fovea. The force that deforms the retina within the FAZ seems likely to be intraocular pressure. Centripetal displacement of cells in the outer layers of the retina continues, as indicated by the large grey arrows. Cones outside the fovea are narrower and more elongated than those within the developing fovea. C: By birth the GCL is significantly reduced in thickness, due to the centrifugal displacement of ganglion cells (indicated by arrows in the inner retina). However, all cell layers are present within the fovea at birth. Retinal vessels are present in the INL, although anatomosis between the layers is not complete. Cones on the foveal rim are significantly elongated, the cell bodies are stacked, and their inner segments are distinct. Cones in the fovea remain in a monolayer, are less elongated and have only rudimentary inner and outer segments. D: In the first few weeks postnatal, cones in the central fovea differentiate rapidly so that by 1–2 months the central cones are more elongated and have longer axons (fibres of Henle) than those on the edge of the fovea (compare with C). Ganglion cells, bipolar cells and the synaptic pedicles of cones have been displaced from the central fovea. The perifoveal capillaries have formed an anastomosis around the fovea. The mature form of the fovea (not shown - see Fig 5D) continues to develop over a period of many months, and includes further centripetal displacement of photoreceptors (increasing photoreceptor density in the foveola), continued centrifugal displacement of bipolar and ganglion cells, and morphological remodeling of the shape of the depression. INL, inner nuclear layer; ILM, inner limiting membrane; IPL, inner plexiform layer; ELM, external limiting membrane; fH, fibres of Henle; GCL, ganglion cell layer; NFL, nerve fibre layer; ONL, outer nuclear layer; OPL, outer plexiform layer; P, postnatal; RPE, retinal pigmented epiltheilum; WG, weeks' gestation.
Figure 7
Figure 7
A comparison of histological and OCT images of the cross-sectional appearance of the human retina, at the fovea centralis. A: Histological section of an adult retina (77 years old), showing the layers of the retina. B: SDOCT imaging of a 28 year old subject. The inset shows the same histological image (A) on the same scale as the SDOCT image (aspect ratio 1 : 2.8). Abbreviations: NFL, nerve fiber layer; GCL, ganglion cell layer; IPL, inner plexiform layer; INL, inner nuclear layer; OPL, outer plexiform layer; FAZ, foveal avascular zone; HFL, Henle fiber layer; ONL, outer nuclear layer; ELM, external limiting membrane; IS, inner segment; OS, outer segment; RPE, retinal pigmented epithelium. Scale bars represent 200 μm.
Figure 8
Figure 8
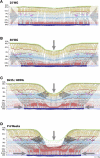
The different morphologies of the fovea and foveal avascular zones in three individuals. The left column shows the retina in cross section (B-scan); the middle column is a 3D macular thickness plot; the right hand column shows vessels in the central macula, obtained by fluorescein angiography. A, B: A broad and deep fovea is typically seen in individuals of African American descent. C: The FAZ of the same subject is ~800–1000 μm in diameter. D, E: The shallow fovea of a Caucasian subject that is associated (F) with a smaller FAZ. G, H: An albinotic subject who lacks a fovea, and (I) also lacks a foveal avascular area. Note that the central photoreceptors are elongated in the central area (between the arrows), despite the absence of the fovea. Scale bars represents 100 μm.
Figure 9
Figure 9
An example of an AOSLO image of the photoreceptor mosaic, from the same albinotic individual as illustrated in Fig 8 (G–I). Peak cone density in this individual was at the lower end of the normal range (97,182 cones/mm2). The image shows evidence of a narrowing of apertures in the cluster of cones seen just below the center of the image, and just above the fixation point (indicated by the asterisk). Scale bar represents 100 μm.
Figure 10
Figure 10
Effect of apodizing a 6 mm pupil by the Stiles Crawford effect. The central photo shows the normal retinal appearance of a 0.1 logmar letter `E'. The manipulations include ±2D of defocus and neutralising (top row) or doubling the apodization (bottom row). The SC-effect also appears to give some tolerance to myopic defocus. Reproduced with permission from Atchison et al., 2002.
Figure 11
Figure 11
The progress of two narrow laser beams placed at y0 and y1 traversing a guinea pig retina along Müller cell processes, and forming two reasonably well resolved spot of light at the photoreceptor level (to the right). Reproduced with permission from Agte et al., 2011
Figure 12
Figure 12
Plot showing the locations the four `windows' of infrared transmission (open circles) in relation to shifts of the focal point, as a function of wavelength, for 3 pupil diameters (2, 2.25 and 2.5 mm). When the pupil diameter is near in size to the wavelength (or if the focal length is very long), diffraction operates to move the axial focal point closer to the lens, compared to the expectation for geometric optics (quantified by the Fresnel number).

References

    1. Abramov I, Gordon J, Hendrickson A, Hainline L, Dobson V, LaBossiere E. The retina of the newborn human infant. Science. 1982;217:265–7. - PubMed
    1. Adams DL, Horton JC. The representation of retinal blood vessels in primate striate cortex. J Neurosci. 2003;23:5984–97. - PMC - PubMed
    1. Agte S, Junek S, Matthias S, Ulbricht E, Erdmann I, Wurm A, Schild D, Kas JA, Reichenbach A. Muller glial cell-provided cellular light guidance through the vital guinea-pig retina. Biophysical journal. 2011;101:2611–9. - PMC - PubMed
    1. Akeo K, Shirai S, Okisaka S, Shimizu H, Miyata H, Kikuchi A, Nishikawa T, Suzumori K, Fujiwara T, Majima A. Histology of fetal eyes with oculocutaneous albinism. Arch Ophthalmol. 1996;114:613–6. - PubMed
    1. Akerblom H, Larsson E, Eriksson U, Holmstrom G. Central macular thickness is correlated with gestational age at birth in prematurely born children. Br J Ophthalmol. 2011;95:799–803. - PubMed

Publication types

MeSH terms