Engineering improved T cell receptors using an alanine-scan guided T cell display selection system
- PMID: 23500145
- PMCID: PMC3668434
- DOI: 10.1016/j.jim.2013.02.018
Engineering improved T cell receptors using an alanine-scan guided T cell display selection system
Abstract
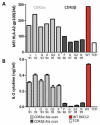
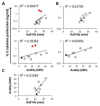
T cell receptors (TCRs) on T cells recognize peptide-major histocompatibility complex (pMHC) molecules on the surface of antigen presenting cells and this interaction determines the T cell immune response. Due to negative selection, naturally occurring TCRs bind self (tumor) peptides with low affinity and have a much higher affinity for foreign antigens. This complicates isolation of naturally occurring, high affinity TCRs that mediate more effective tumor rejection for therapeutic purposes. An attractive approach to resolve this issue is to engineer high affinity TCRs in vitro using phage, yeast or mammalian TCR display systems. A caveat of these systems is that they rely on a large library by random mutagenesis due to the lack of knowledge regarding the specific interactions between the TCR and pMHC. We have focused on the mammalian retroviral display system because it uniquely allows for direct comparison of TCR-pMHC-binding properties with T-cell activation outcomes. Through an alanine-scanning approach, we are able to quickly map the key amino acid residues directly involved in TCR-pMHC interactions thereby significantly reducing the library size. Using this method, we demonstrate that for a self-antigen-specific human TCR (R6C12) the key residues for pMHC binding are located in the CDR3β region. This information was used as a basis for designing an efficacious TCR CDR3α library that allowed for selection of TCRs with higher avidity than the wild-type as evaluated through binding and activation experiments. This is a direct approach to target specific TCR residues in TCR library design to efficiently engineer high avidity TCRs that may potentially be used to enhance adoptive immunotherapy treatments.
Copyright © 2013 Elsevier B.V. All rights reserved.
Figures


Similar articles
-
Chronic TCR-MHC (self)-interactions limit the functional potential of TCR affinity-increased CD8 T lymphocytes.J Immunother Cancer. 2019 Nov 5;7(1):284. doi: 10.1186/s40425-019-0773-z. J Immunother Cancer. 2019. PMID: 31690351 Free PMC article.
-
Identification of a crucial energetic footprint on the alpha1 helix of human histocompatibility leukocyte antigen (HLA)-A2 that provides functional interactions for recognition by tax peptide/HLA-A2-specific T cell receptors.J Exp Med. 2001 Mar 5;193(5):551-62. doi: 10.1084/jem.193.5.551. J Exp Med. 2001. PMID: 11238586 Free PMC article.
-
A structural-based machine learning method to classify binding affinities between TCR and peptide-MHC complexes.Mol Immunol. 2021 Nov;139:76-86. doi: 10.1016/j.molimm.2021.07.020. Epub 2021 Aug 26. Mol Immunol. 2021. PMID: 34455212 Free PMC article.
-
Modulation of T cell function by TCR/pMHC binding kinetics.Immunobiology. 2006;211(1-2):47-64. doi: 10.1016/j.imbio.2005.09.003. Epub 2006 Jan 4. Immunobiology. 2006. PMID: 16446170 Review.
-
Structural basis for self-recognition by autoimmune T-cell receptors.Immunol Rev. 2012 Nov;250(1):32-48. doi: 10.1111/imr.12002. Immunol Rev. 2012. PMID: 23046121 Review.
Cited by
-
Advancements in mammalian display technology for therapeutic antibody development and beyond: current landscape, challenges, and future prospects.Front Immunol. 2024 Sep 24;15:1469329. doi: 10.3389/fimmu.2024.1469329. eCollection 2024. Front Immunol. 2024. PMID: 39381002 Free PMC article. Review.
-
Novel insights into TCR-T cell therapy in solid neoplasms: optimizing adoptive immunotherapy.Exp Hematol Oncol. 2024 Apr 3;13(1):37. doi: 10.1186/s40164-024-00504-8. Exp Hematol Oncol. 2024. PMID: 38570883 Free PMC article. Review.
-
Challenges and solutions for therapeutic TCR-based agents.Immunol Rev. 2023 Nov;320(1):58-82. doi: 10.1111/imr.13233. Epub 2023 Jul 16. Immunol Rev. 2023. PMID: 37455333 Free PMC article. Review.
-
Immune Literacy: Reading, Writing, and Editing Adaptive Immunity.iScience. 2020 Sep 25;23(9):101519. doi: 10.1016/j.isci.2020.101519. Epub 2020 Sep 1. iScience. 2020. PMID: 32905040 Free PMC article. Review.
-
Weaponizing T-cell receptors through molecular engineering.J Biol Chem. 2019 Apr 12;294(15):5805-5806. doi: 10.1074/jbc.H119.008479. J Biol Chem. 2019. PMID: 30979848 Free PMC article.
References
-
- Altman JD, Moss PA, et al. Phenotypic analysis of antigen-specific T lymphocytes. Science. 1996;274(5284):94–96. - PubMed
-
- Boniface JJ, Rabinowitz JD, et al. Initiation of signal transduction through the T cell receptor requires the multivalent engagement of peptide/MHC ligands [corrected] Immunity. 1998;9(4):459–466. - PubMed
-
- Boon T, Coulie PG, et al. Tumor antigens recognized by T cells. Immunology today. 1997;18(6):267–268. - PubMed
Publication types
MeSH terms
Substances
Grants and funding
LinkOut - more resources
Full Text Sources
Other Literature Sources

