

Air pollution and health risks due to vehicle traffic
- PMID: 23500830
- PMCID: PMC4243514
- DOI: 10.1016/j.scitotenv.2013.01.074
Air pollution and health risks due to vehicle traffic
Abstract
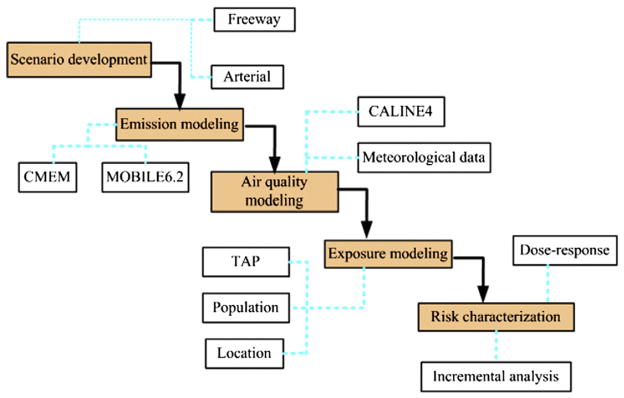
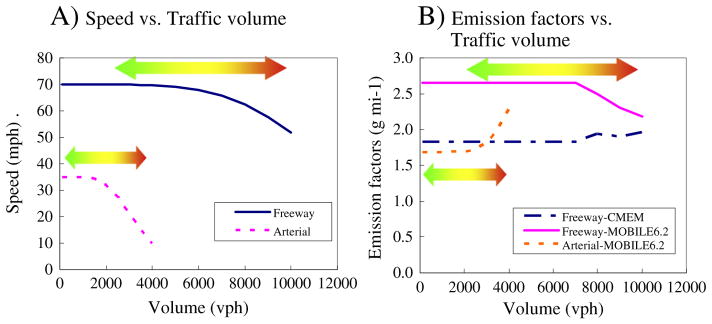
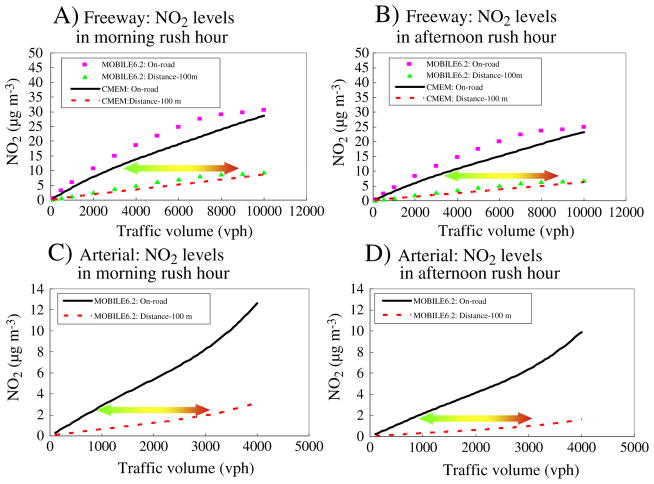
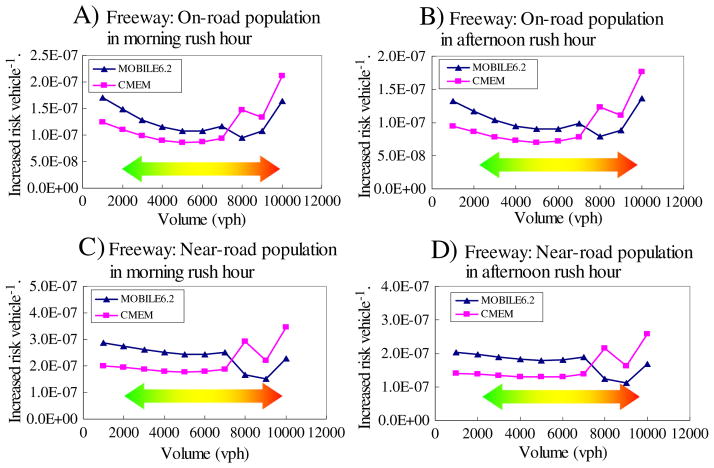
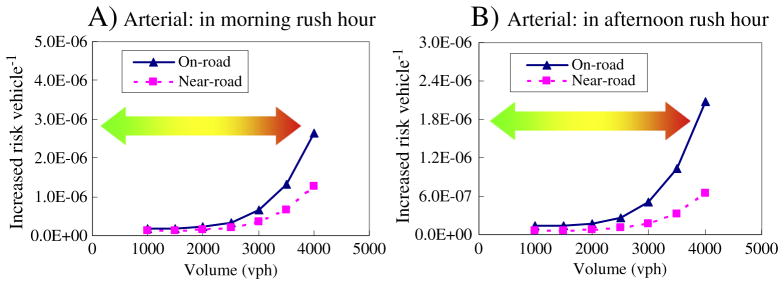
Traffic congestion increases vehicle emissions and degrades ambient air quality, and recent studies have shown excess morbidity and mortality for drivers, commuters and individuals living near major roadways. Presently, our understanding of the air pollution impacts from congestion on roads is very limited. This study demonstrates an approach to characterize risks of traffic for on- and near-road populations. Simulation modeling was used to estimate on- and near-road NO2 concentrations and health risks for freeway and arterial scenarios attributable to traffic for different traffic volumes during rush hour periods. The modeling used emission factors from two different models (Comprehensive Modal Emissions Model and Motor Vehicle Emissions Factor Model version 6.2), an empirical traffic speed-volume relationship, the California Line Source Dispersion Model, an empirical NO2-NOx relationship, estimated travel time changes during congestion, and concentration-response relationships from the literature, which give emergency doctor visits, hospital admissions and mortality attributed to NO2 exposure. An incremental analysis, which expresses the change in health risks for small increases in traffic volume, showed non-linear effects. For a freeway, "U" shaped trends of incremental risks were predicted for on-road populations, and incremental risks are flat at low traffic volumes for near-road populations. For an arterial road, incremental risks increased sharply for both on- and near-road populations as traffic increased. These patterns result from changes in emission factors, the NO2-NOx relationship, the travel delay for the on-road population, and the extended duration of rush hour for the near-road population. This study suggests that health risks from congestion are potentially significant, and that additional traffic can significantly increase risks, depending on the type of road and other factors. Further, evaluations of risk associated with congestion must consider travel time, the duration of rush-hour, congestion-specific emission estimates, and uncertainties.
Copyright © 2013 Elsevier B.V. All rights reserved.
Figures
References
-
- Benson P. FHWA-CA-TL-84-15. Sacramento, CA: California Department of Transportation; 1989. CALINE4 — a dispersion model for prediction air pollutant concentrations near roadways.
-
- Brown SG, Wade KS, Hafner HR. [Accessed April 2, 2010];Summary of recent ambient air quality and accountability analyses in the Detroit area. 2007 http://www.epa.gov/airtrends/specialstudies/2007detroit_summary_report.pdf.
-
- Department for Environment, Food and Rural Affairs. [Accessed April 2, 2010];Part IV of the Environment Act 1995, Local Air Quality Management Technical Guidance. 2003 :6–33. http://www.ni-environment.gov.uk/technical_guidance.pdf.
Publication types
MeSH terms
Substances
Grants and funding
LinkOut - more resources
Full Text Sources
Other Literature Sources
