. 2013 Apr;15(4):385-94.
doi: 10.1038/ncb2698. Epub 2013 Mar 17.

C/EBPa controls acquisition and maintenance of adult haematopoietic stem cell quiescence

Affiliations

C/EBPa controls acquisition and maintenance of adult haematopoietic stem cell quiescence

Min Ye et al. Nat Cell Biol. 2013 Apr.

Abstract

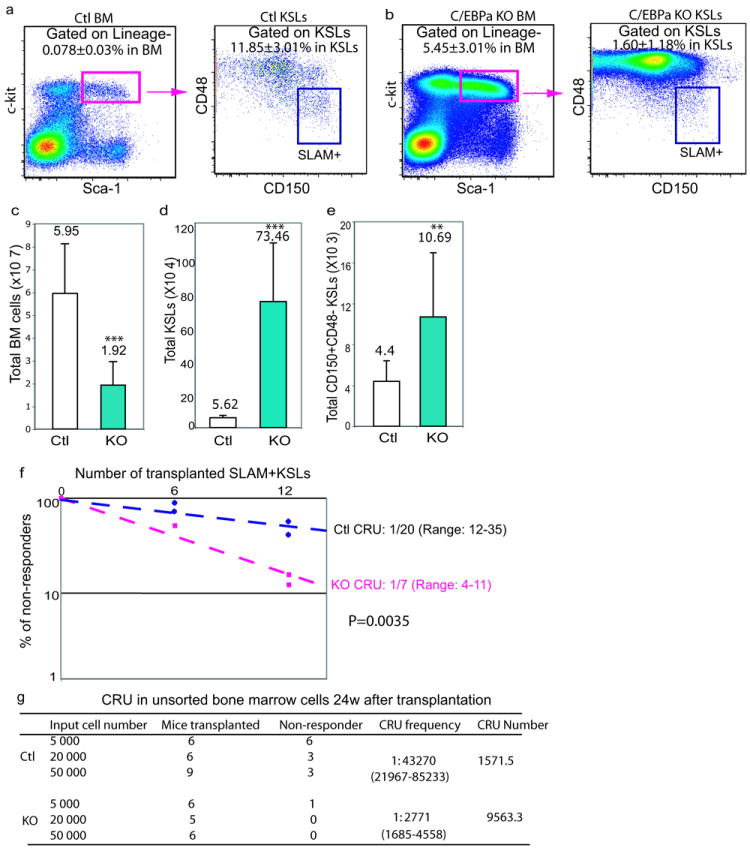
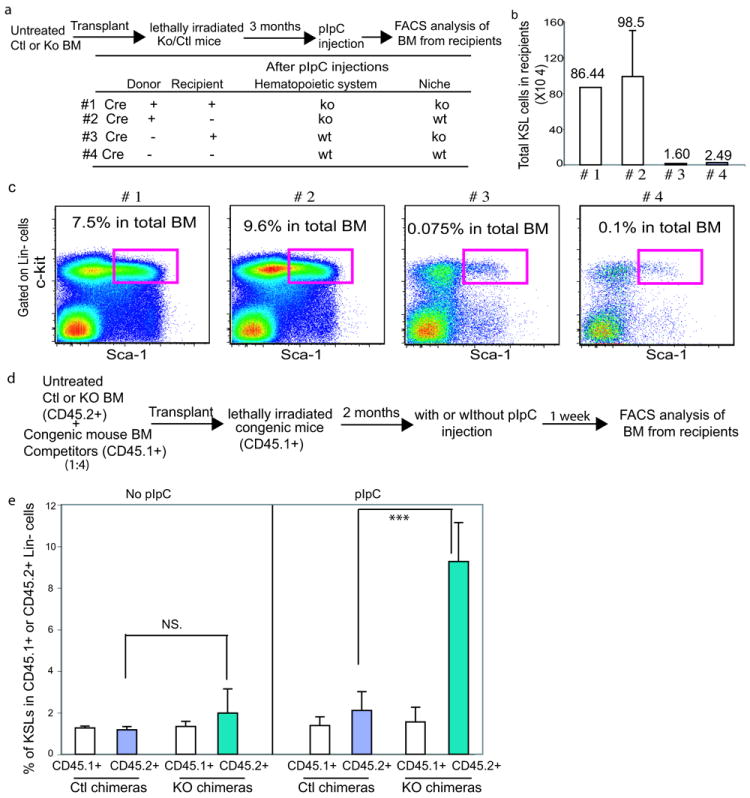
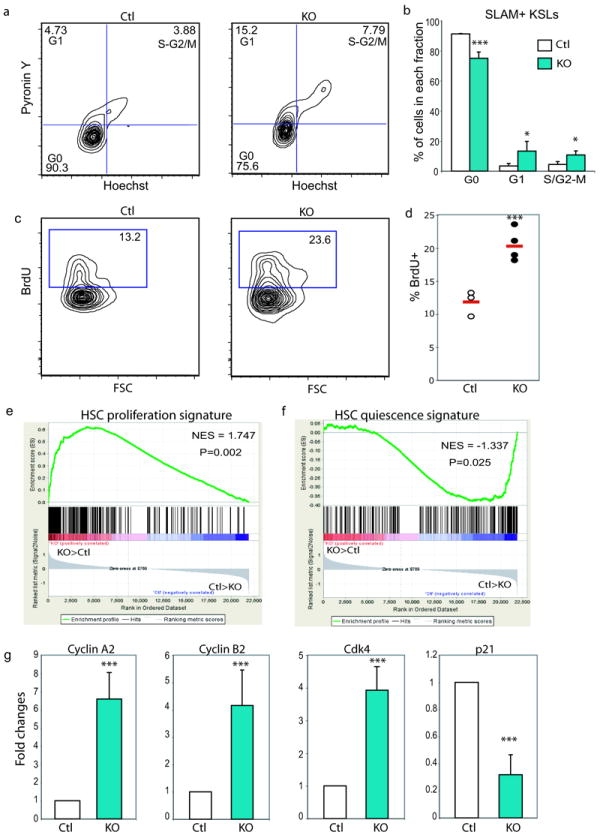
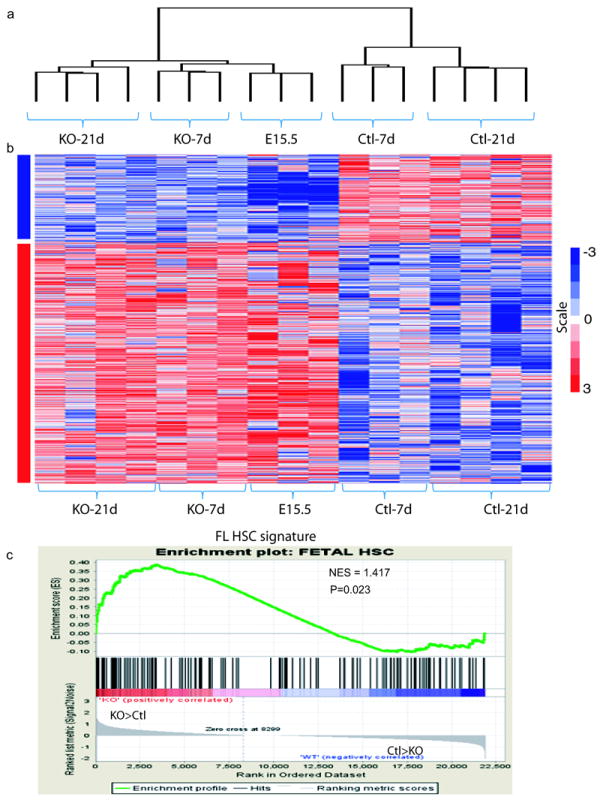
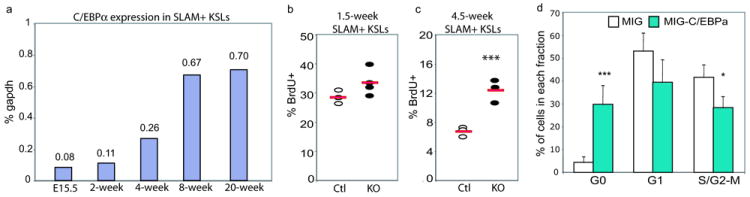
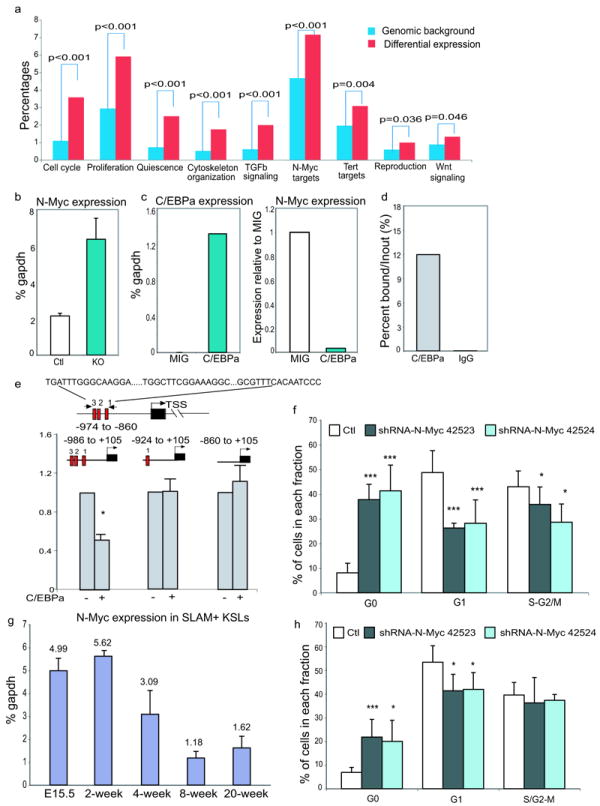
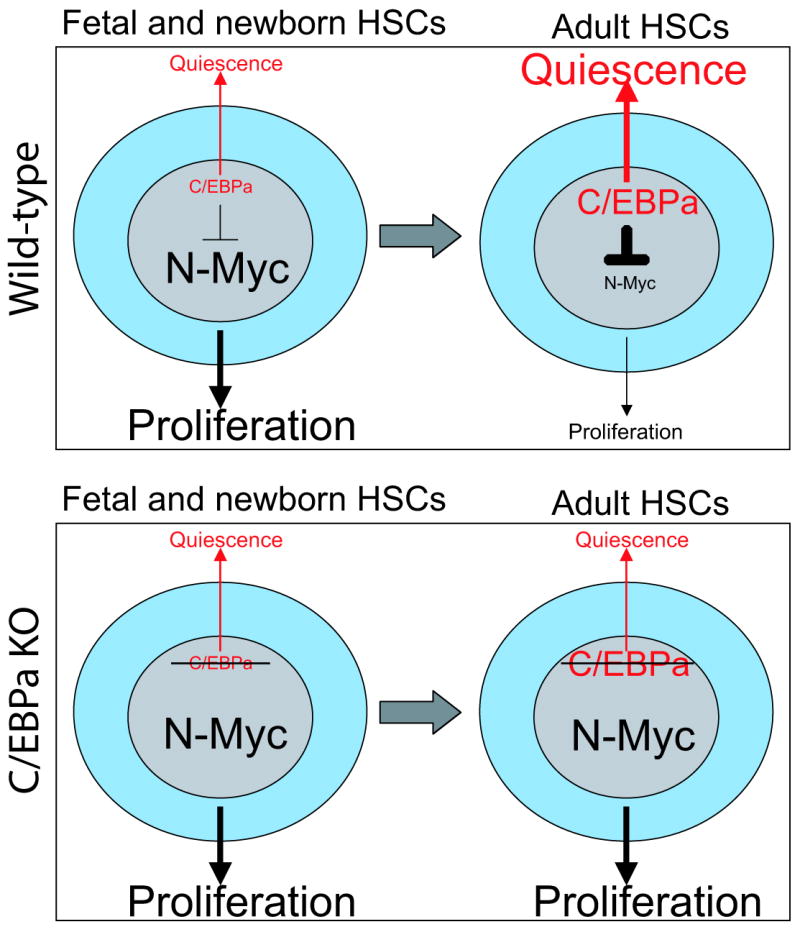
In blood, the transcription factor C/EBPa is essential for myeloid differentiation and has been implicated in regulating self-renewal of fetal liver haematopoietic stem cells (HSCs). However, its function in adult HSCs has remained unknown. Here, using an inducible knockout model we found that C/EBPa-deficient adult HSCs underwent a pronounced increase in number with enhanced proliferation, characteristics resembling fetal liver HSCs. Consistently, transcription profiling of C/EBPa-deficient HSCs revealed a gene expression program similar to fetal liver HSCs. Moreover, we observed that age-specific Cebpa expression correlated with its inhibitory effect on the HSC cell cycle. Mechanistically we identified N-Myc as a downstream target of C/EBPa, and loss of C/EBPa resulted in de-repression of N-Myc. Our data establish C/EBPa as a central determinant in the switch from fetal to adult HSCs.


Conflict of interest statement

Conflict-of-interest disclosure: The authors declare no competing financial interests.

Figures

Figure 1
Figure 1
Loss of C/EBPa increases the number of phenotypic and functional hematopoietic stem cells (HSCs) (a, b) Increased frequency of Lineage-c-kit+Sca-1+ cells (KSLs), but decreased frequency of HSC-enriched CD150+CD48- (SLAM+) in the KSL fraction in C/EBPa conditional knockout (KO) mouse bone marrow. Representative FACS plots analyzing bone marrow cells 5-7 days after last pIpC injections are shown for control (Ctl, a) and KO (b) mice. Numbers in plots indicate average percentages of boxed populations (±SD) among total bone marrow cells or gated populations (p<0.005, data pooled from four independent experiments to obtain n=15 per genotype). (c-e) Total numbers of bone marrow cells (c), KSLs (d), SLAM+KSLs (e) in the bone marrow (2 femurs, tibias and humerus) of Ctl and KO mice; mean values (±SD) are shown (**p<0.01 and ***p<0.005, data pooled from four independent experiments to obtain n=15 per genotype). (f, g) Loss of C/EBPa increases the number of functional HSCs in adult mice. Limiting-dilution competitive repopulation analyses using either two doses (6 and 12 cells) of sorted SLAM+KSLs (f) or three doses (5000, 20000, and 50000 cells) of whole bone marrow cells (g). Non-responders are defined as recipients with less than 0.3% donor-derived myeloid and/or lymphoid cells in nucleated peripheral blood cells. The frequency of functional HSCs (competitive repopulation units, CRU) was calculated according to Poisson statistics using L-Calc software (P<0.005). f, plotted is the percentage of non-responders 24 weeks after transplantation versus the number of initial SLAM+KSLs from two independent experiments. g, the frequency and the total number of CRU in bone marrow per mouse were measured and calculated. See also Figure S1 and table S6 for raw values for figure S1.
Figure 2
Figure 2
HSC expansion upon loss of C/EBPa is hematopoietic cell intrinsic (a-c) Bone marrow chimeras. 2×10⁶ total bone marrow cells from either Mx.1-Cre- C/EBPaloxP/loxP or Mx.1-Cre+ C/EBPaloxP/loxP mice were transplanted into lethally irradiated Mx.1-Cre+ C/EBPaloxP/loxP or Mx.1-Cre- C/EBPaloxP/loxP recipients prior to pIpC injections. After stable engraftment (3 months), pIpC was administered to induce deletion. The chimeras were analyzed 2 weeks after the last injection. (a) experimental outline; (b) total number of KSLs in the chimeric mouse bone marrow; mean values (±SD) are shown (n=2 mice for group #1, 3 and 4, and n=3 mice for group #2); and (c) representative FACS analyses of lineage-negative bone marrow cells. (d, e) Competitive bone marrow chimeras. Untreated Mx.1-Cre- C/EBPaloxP/loxP and Mx.1-Cre+ C/EBPaloxP/loxP bone marrow cells were mixed with CD45.1+ wild type congenic mouse bone marrow at a 1:4 ratio and transplanted into lethally irradiated CD45.1+ recipients. C/EBPa excision was induced 2 months after transplantation by pIpC injection and mice were analyzed 7 days after the last injection. (d) Experiment outline, and (e) Percentages of KSL cells in either CD45.1+ Lin- or CD45.2+ Lin- population in bone marrow chimeras. Values are means (±SD) (n=3 mice for each chimera group, ***p<0.005; NS stands for no statistical significance). See also Figure S2 and Table S6 for the raw data for panels 2b and 2e.
Figure 3
Figure 3
Loss of C/EBPa increases HSC proliferation (a) Pyronin Y/Hoechst staining showing cell cycle status of SLAM+KSLs in control and KO mice 5 days after pIpC injections. (b) Distribution of SLAM+KSLs in G0, G1 and S/G2-M phases. Mean values (±SD) are shown (n=3 independent mice for each group, ***p<0.005 and *p<0.05). (c) Representative FACS plots demonstrating BrdU incorporation in donor derived SLAM+KSLs 20 hours after BrdU injection in reconstituted chimera mouse bone marrow four months after pIpC administration (***p<0.005). (d) Percentage of BrdU+ cells in donor-derived SLAM+KSLs sorted from control and KO chimeras (***p<0.005). (e, f) GSEA comparison of KO and control SLAM+KSLs for enrichment/depletion of HSC proliferation-associated gene expression (e) and quiescence associated gene expression (f). The normalized enrichment scores (NES) and p values are indicated in each plot. (g) qPCR analysis of the expression of selected cell cycle related genes that were differentially expressed by KO versus control SLAM+ KSLs revealed by microarray analysis. The results shown are the relative expression levels and expressed as fold difference compared to the levels (set to 1) detected in control SLAM+ KSLs. The data are the averages ± SD for n=3 independently sorted SLAM+ KSLs per group two weeks after pIpC injections. The average for each sample was calculated from duplicate measurements. (***p<0.005, gapdh normalization). See also Figure S3 and table S6 for the raw data for panels 3b, 3g, S3b and S3d.
Figure 4
Figure 4
Loss of C/EBPa in adult HSCs results in transcriptional alterations that resemble fetal liver (FL) HSCs (a) Unsupervised clustering of control, KO bone marrow HSCs (7 days and 21 days after pIpC injection) and E15.5 FL HSCs using differentially expressed genes (DEG) between control and KO. (b) The heat map represents gene signature shared by KO adult HSCs and E15.5 FL HSCs, but distinct from that of control adult HSCs (1.5 change-filtered, P < 0.05). (c) GSEA comparison of KO and control adult HSCs for enrichment/depletion of FL HSC associated gene expression. The normalized enrichment scores (NES) and p values are indicated on each plot. See also Table S1.
Figure 5
Figure 5
Up-regulation of C/EBPa limits HSC proliferation (a) qPCR analysis showing levels of C/EBPa in SLAM+KSLs from E15.5 fetal liver (Mac-1low SLAM+KSLs), bone marrow of 2-week old mice (Mac-1low SLAM+KSLs) and 4-, 8- and 20-week old mice (Mac-1- SLAM+KSL), respectively. Mean value of duplicate measurements of C/EBPa levels relative to gapdh from one representative experiment are shown in the plot. Data show result of one of three independent experiments. (b, c) Percentage of BrdU+ cells in SLAM+ KSLs from 1.5-week old (b) or 4.5-week old control and KO mice (c) 14 hours after Brdu incorporation (***p<0.005). Data are obtained from two independent experiments. (d) Over-expression of C/EBPa decreased fetal liver KSL proliferation. Percentage of GFP+c-kit+ FL KSLs in G0, G1 and S/G2-M phase 48 hours following infection with MSCV-GFP-C/EBPa (MIG-C/EBPa) or MIG control virus, measured by Pyronin/Hoechest staining. Mean value (±SD) are shown (n=3 of independent FL KSL samples for each group, data collected over two experiments: one sample coming from one experiment and 2 from the other experiment, ***p<0.005, *p<0.05). See also Figure S4 and table S6 for the raw data for panels 5a and 5d.
Figure 6
Figure 6
N-Myc is a downstream target of C/EBPa that mediates its regulation of HSC proliferation during fetal to adult transition (a) Pathway analysis indicating enriched gene sets and pathways downstream of C/EBPa. Percentages in the y axis represent either the percentage of the number of genes in the pathway of interest relative to the total number of genes (Genomic background, blue bars), or the number of differentially expressed genes in the pathway of interest to all differentially expressed genes (Differential expression, red bars). (b) Up-regulation of N-Myc expression in KO SLAM+KSLs measured by qPCR. Results are shown as mean (±SD) of triplicate measurements of relative mRNA in one representative experiment (normalized to gapdh). Data show results of one of three independent experiments. (c) Re-introduction of C/EBPa into C/EBPa KO KSLs reduces N-Myc expression. Results from one representative experiment are shown. Left, mean value of duplicate measurements of C/EBPa; right, mean value of the relative N-Myc expression in MIG-C/EBPa infected KO KSLs, with the levels in MIG-infected cells set to 1. Data show results of one of two independent experiments. (d) ChIP-qPCR analysis confirms specific binding of CEBPa to the N-Myc promoter in hematopoietic stem/progenitor cells (Lineage- c-kit+). Results are shown as mean value of duplicate measurements. Data show results of one of two independent experiments. (e) Upper, schematic diagram showing three potential C/EBPa binding sites within the N-Myc proximal promoter. Red bars represent consensus C/EBPa binding sites and black bar represents N-Myc gene. lower, reporter assays comparing transcriptional activity of reporter constructs with full length or truncated N-Myc promoters upon the addition of C/EBPa in HEK293 cells. Mean value (±SD) of triplicate measurements of one of two independent experiments are shown. (f) shRNA-mediated knocking-down of N-Myc in adult C/EBPa-deficient KSLs decreased their proliferation as measured by Pyronin/Hoechst staining. Results are shown as mean value (±SD) (n=7 independent samples for each group, pooled over three experiments). (g) qPCR of N-Myc in SLAM+KSLs. Results are shown as mean (±SD) of triplicate measurements of N-Myc transcripts in one of two independent experiments. (h) shRNA-mediated knocking down of N-Myc in FL KSLs decreased their proliferation. Results are shown as mean value (±SD) (n=4 independent samples per group, data pooled over two experiments, ***p<0.005 and *p<0.05). See also Figure S5 and table S6 for the raw data for panels 6b, 6c, 6d, 6e, 6g, 6h and S5a.
Figure 7
Figure 7
C/EBPa plays a key role in regulating acquisition and maintenance of adult HSC quiescence Model summarizing the modulation of HSC proliferation properties by C/EBPa during fetal/adult transition. Top panel: Fetal and newborn HSCs express low levels of C/EBPa and high levels of N-Myc, which sustain the active proliferation of fetal HSCs. During the fetal to adult transtition, C/EBPa expression increases in HSCs, which subsequently inhibits N-Myc activity through direct transcriptional repression. As a consequence, HSCs become quiescent. Bottom panel: Inactivation of C/EBPa by conditional ablation of C/EBPa releases its inhibition of N-Myc expression. Elevated N-Myc expression in adult HSCs re-activates their proliferation that resembles the fetal HSC.

References

    1. Morrison SJ, Hemmati HD, Wandycz AM, Weissman IL. The purification and characterization of fetal liver hematopoietic stem cells. Proc Natl Acad Sci U S A. 1995;92:10302–6. - PMC - PubMed
    1. Ema H, Nakauchi H. Expansion of hematopoietic stem cells in the developing liver of a mouse embryo. Blood. 2000;95:2284–8. - PubMed
    1. Morrison SJ, Weissman IL. The long-term repopulating subset of hematopoietic stem cells is deterministic and isolatable by phenotype. Immunity. 1994;1:661–73. - PubMed
    1. Goodell MA, Brose K, Paradis G, Conner AS, Mulligan RC. Isolation and functional properties of murine hematopoietic stem cells that are replicating in vivo. J Exp Med. 1996;183:1797–806. - PMC - PubMed
    1. Cheshier SH, Morrison SJ, Liao X, Weissman IL. In vivo proliferation and cell cycle kinetics of long-term self-renewing hematopoietic stem cells. Proc Natl Acad Sci U S A. 1999;96:3120–5. - PMC - PubMed

Publication types

MeSH terms