

Frequency representation within the human brain: stability versus plasticity
- PMID: 23502431
- PMCID: PMC3600597
- DOI: 10.1038/srep01474
Frequency representation within the human brain: stability versus plasticity
Abstract
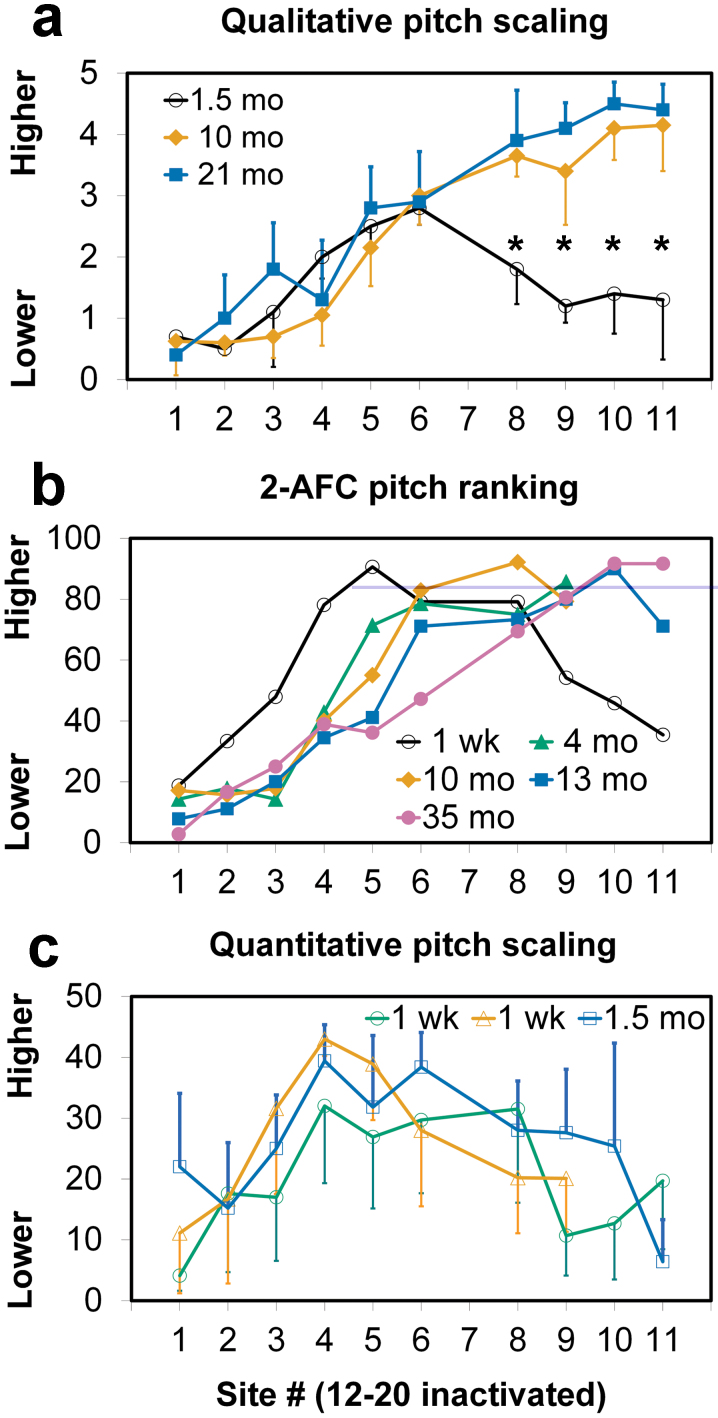
A topographical representation for frequency has been identified throughout the auditory brain in animals but with limited evidence in humans. Using a midbrain implant, we identified an ordering of pitch percepts for electrical stimulation of sites across the human inferior colliculus (IC) that was consistent with the IC tonotopy shown in animals. Low pitches were perceived by the subject for stimulation of superficial IC sites while higher pitches were perceived for stimulation of deeper sites. Interestingly, this pitch ordering was not initially observed for stimulation across the IC, possibly due to central changes caused by prior hearing loss. Daily implant stimulation for about 4 months altered the pitch percepts from being predominantly low to exhibiting the expected ordering across the stimulated IC. A presumably normal tonotopic representation may have been maintained within the IC or accessible through IC stimulation that helped form this pitch ordering perceived in higher centers.
Figures


Similar articles
-
Effects of phase duration and pulse rate on loudness and pitch percepts in the first auditory midbrain implant patients: Comparison to cochlear implant and auditory brainstem implant results.Neuroscience. 2008 Jun 12;154(1):370-80. doi: 10.1016/j.neuroscience.2008.02.041. Epub 2008 Feb 29. Neuroscience. 2008. PMID: 18384971 Clinical Trial.
-
Intralaminar stimulation of the inferior colliculus facilitates frequency-specific activation in the auditory cortex.J Neural Eng. 2013 Aug;10(4):046008. doi: 10.1088/1741-2560/10/4/046008. Epub 2013 Jun 26. J Neural Eng. 2013. PMID: 23800787
-
Plasticity in central representations in the inferior colliculus induced by chronic single- vs. two-channel electrical stimulation by a cochlear implant after neonatal deafness.Hear Res. 2000 Sep;147(1-2):221-41. doi: 10.1016/s0378-5955(00)00133-7. Hear Res. 2000. PMID: 10962187
-
Plasticity of tonotopic maps in humans: influence of hearing loss, hearing aids and cochlear implants.Acta Otolaryngol. 2010 Mar;130(3):333-7. doi: 10.3109/00016480903258024. Acta Otolaryngol. 2010. PMID: 19845491 Review.
-
Electrical stimulation of the auditory nerve: the coding of frequency, the perception of pitch and the development of cochlear implant speech processing strategies for profoundly deaf people.Clin Exp Pharmacol Physiol. 1996 Sep;23(9):766-76. doi: 10.1111/j.1440-1681.1996.tb01178.x. Clin Exp Pharmacol Physiol. 1996. PMID: 8911712 Review.
Cited by
-
Auditory midbrain implant: research and development towards a second clinical trial.Hear Res. 2015 Apr;322:212-23. doi: 10.1016/j.heares.2015.01.006. Epub 2015 Jan 20. Hear Res. 2015. PMID: 25613994 Free PMC article. Review.
-
Effects of Electrical Stimulation in the Inferior Colliculus on Frequency Discrimination by Rhesus Monkeys and Implications for the Auditory Midbrain Implant.J Neurosci. 2016 May 4;36(18):5071-83. doi: 10.1523/JNEUROSCI.3540-15.2016. J Neurosci. 2016. PMID: 27147659 Free PMC article.
-
Neural integration and enhancement from the inferior colliculus up to different layers of auditory cortex.J Neurophysiol. 2013 Aug;110(4):1009-20. doi: 10.1152/jn.00022.2013. Epub 2013 May 29. J Neurophysiol. 2013. PMID: 23719210 Free PMC article.
-
Effects of location and timing of co-activated neurons in the auditory midbrain on cortical activity: implications for a new central auditory prosthesis.J Neural Eng. 2014 Aug;11(4):046021. doi: 10.1088/1741-2560/11/4/046021. Epub 2014 Jul 8. J Neural Eng. 2014. PMID: 25003629 Free PMC article.
-
Investigation of a new electrode array technology for a central auditory prosthesis.PLoS One. 2013 Dec 2;8(12):e82148. doi: 10.1371/journal.pone.0082148. eCollection 2013. PLoS One. 2013. PMID: 24312638 Free PMC article.
References
-
- Levelt C. N. & Hubener M. Critical-period plasticity in the visual cortex. Annu Rev Neurosci 35, 309–330 (2012). - PubMed
-
- de Villers-Sidani E. & Merzenich M. M. Lifelong plasticity in the rat auditory cortex: basic mechanisms and role of sensory experience. Prog Brain Res 191, 119–131 (2011). - PubMed
-
- Jones E. G. Cortical and subcortical contributions to activity-dependent plasticity in primate somatosensory cortex. Annu Rev Neurosci 23, 1–37 (2000). - PubMed
-
- Keuroghlian A. S. & Knudsen E. I. Adaptive auditory plasticity in developing and adult animals. Prog Neurobiol 82, 109–121 (2007). - PubMed
Publication types
MeSH terms
LinkOut - more resources
Full Text Sources
Other Literature Sources
