

The G protein-coupled estrogen receptor (GPER) agonist G-1 expands the regulatory T-cell population under TH17-polarizing conditions
- PMID: 23502766
- PMCID: PMC3635139
- DOI: 10.1097/CJI.0b013e31828d8e3b
The G protein-coupled estrogen receptor (GPER) agonist G-1 expands the regulatory T-cell population under TH17-polarizing conditions
Abstract
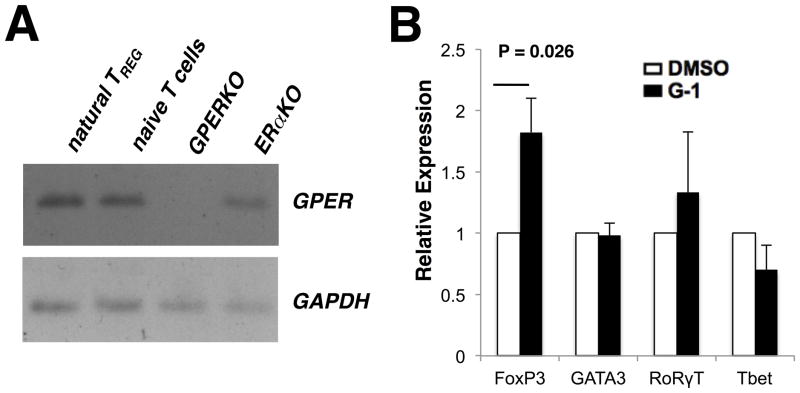
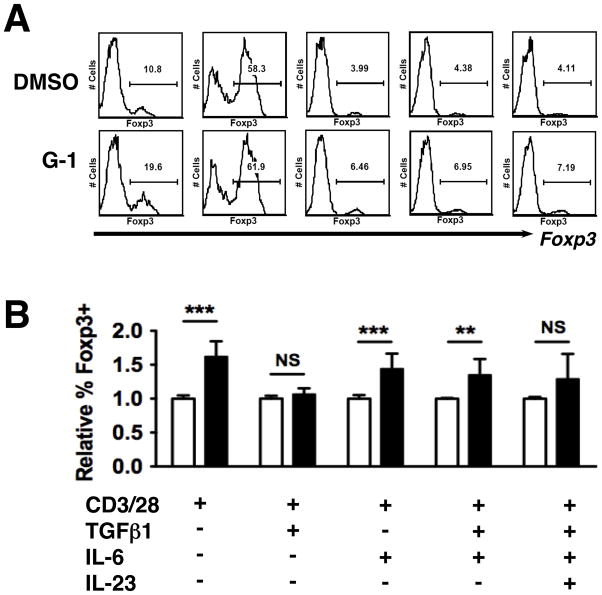
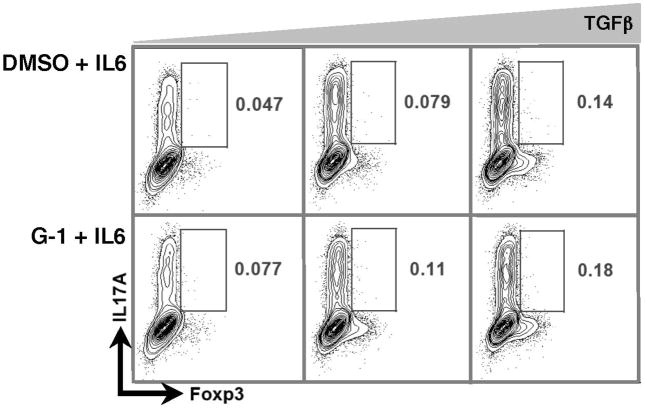
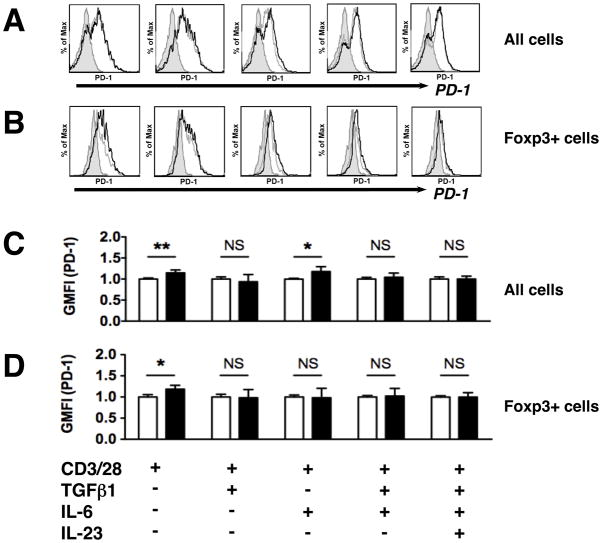
The transcription factor Foxp3 is critical to the suppressive phenotype of CD4+ regulatory T cells. Studies have clearly shown that numerous autoimmune diseases are marked by the presence of activated CD4+ T cells within the setting of chronic inflammation. Therefore, drugs capable of inducing Foxp3 expression in activated CD4+ T cells could be of great therapeutic interest. We have previously shown that the small molecule G-1, an agonist directed against the membrane-bound G protein-coupled estrogen receptor, can induce IL10 expression in naive CD4+ T cells. In addition, we and others have demonstrated that G-1 attenuates disease in an animal model of experimental autoimmune encephalomyelitis. Using ex vivo cultures of purified CD4+ T cells, we show that G-1 can elicit Foxp3 expression under TH17-polarizing conditions, which mimic the in situ inflammatory milieu of several autoimmune diseases. These findings build upon previous results demonstrating the immunosuppressive properties of the novel estrogenic small molecule G-1.
Figures
Similar articles
-
Induction of interleukin-10 in the T helper type 17 effector population by the G protein coupled estrogen receptor (GPER) agonist G-1.Immunology. 2011 Sep;134(1):93-106. doi: 10.1111/j.1365-2567.2011.03471.x. Epub 2011 Jul 2. Immunology. 2011. PMID: 21722102 Free PMC article.
-
Mesenchymal stem cells generate a CD4+CD25+Foxp3+ regulatory T cell population during the differentiation process of Th1 and Th17 cells.Stem Cell Res Ther. 2013 Jun 4;4(3):65. doi: 10.1186/scrt216. Stem Cell Res Ther. 2013. PMID: 23734780 Free PMC article.
-
Bacillus-derived poly-γ-glutamic acid reciprocally regulates the differentiation of T helper 17 and regulatory T cells and attenuates experimental autoimmune encephalomyelitis.Clin Exp Immunol. 2012 Oct;170(1):66-76. doi: 10.1111/j.1365-2249.2012.04637.x. Clin Exp Immunol. 2012. PMID: 22943202 Free PMC article.
-
PDCD5 negatively regulates autoimmunity by upregulating FOXP3(+) regulatory T cells and suppressing Th17 and Th1 responses.J Autoimmun. 2013 Dec;47:34-44. doi: 10.1016/j.jaut.2013.08.002. Epub 2013 Sep 5. J Autoimmun. 2013. PMID: 24012345
-
FOXP3 and RORγt: transcriptional regulation of Treg and Th17.Int Immunopharmacol. 2011 May;11(5):536-42. doi: 10.1016/j.intimp.2010.11.008. Epub 2010 Nov 23. Int Immunopharmacol. 2011. PMID: 21081189 Review.
Cited by
-
Immune Tumor Microenvironment in Breast Cancer and the Participation of Estrogen and Its Receptors in Cancer Physiopathology.Front Immunol. 2019 Mar 1;10:348. doi: 10.3389/fimmu.2019.00348. eCollection 2019. Front Immunol. 2019. PMID: 30881360 Free PMC article. Review.
-
G protein-coupled estrogen receptor-selective ligands modulate endometrial tumor growth.Obstet Gynecol Int. 2013;2013:472720. doi: 10.1155/2013/472720. Epub 2013 Nov 27. Obstet Gynecol Int. 2013. PMID: 24379833 Free PMC article.
-
Insight Into Non-Pathogenic Th17 Cells in Autoimmune Diseases.Front Immunol. 2018 May 28;9:1112. doi: 10.3389/fimmu.2018.01112. eCollection 2018. Front Immunol. 2018. PMID: 29892286 Free PMC article. Review.
-
Estrogen-mediated inactivation of FOXO3a by the G protein-coupled estrogen receptor GPER.BMC Cancer. 2015 Oct 15;15:702. doi: 10.1186/s12885-015-1699-6. BMC Cancer. 2015. PMID: 26470790 Free PMC article.
-
Endogenous and Therapeutic Estrogens: Maestro Conductors of the Microenvironment of ER+ Breast Cancers.Cancers (Basel). 2021 Jul 24;13(15):3725. doi: 10.3390/cancers13153725. Cancers (Basel). 2021. PMID: 34359625 Free PMC article. Review.
References
-
- Fontenot JD, Gavin MA, Rudensky AY. Foxp3 programs the development and function of CD4+CD25+ regulatory T cells. Nature immunology. 2003;4:330–336. - PubMed
-
- Hori S, Nomura T, Sakaguchi S. Control of regulatory T cell development by the transcription factor Foxp3. Science. 2003;299:1057–1061. - PubMed
-
- Khattri R, Cox T, Yasayko SA, Ramsdell F. An essential role for Scurfin in CD4+CD25+ T regulatory cells. Nature immunology. 2003;4:337–342. - PubMed
-
- Patey-Mariaud de Serre N, Canioni D, Ganousse S, Rieux-Laucat F, Goulet O, Ruemmele F, Brousse N. Digestive histopathological presentation of IPEX syndrome. Mod Pathol. 2008 - PubMed
-
- Clark LB, Appleby MW, Brunkow ME, Wilkinson JE, Ziegler SF, Ramsdell F. Cellular and molecular characterization of the scurfy mouse mutant. J Immunol. 1999;162:2546–2554. - PubMed
Publication types
MeSH terms
Substances
Grants and funding
LinkOut - more resources
Full Text Sources
Other Literature Sources
Research Materials
