. 2013 May;23(5):789-99.
doi: 10.1101/gr.143503.112. Epub 2013 Mar 15.

DNA-methylation effect on cotranscriptional splicing is dependent on GC architecture of the exon-intron structure

Affiliations

DNA-methylation effect on cotranscriptional splicing is dependent on GC architecture of the exon-intron structure

Sahar Gelfman et al. Genome Res. 2013 May.

Abstract

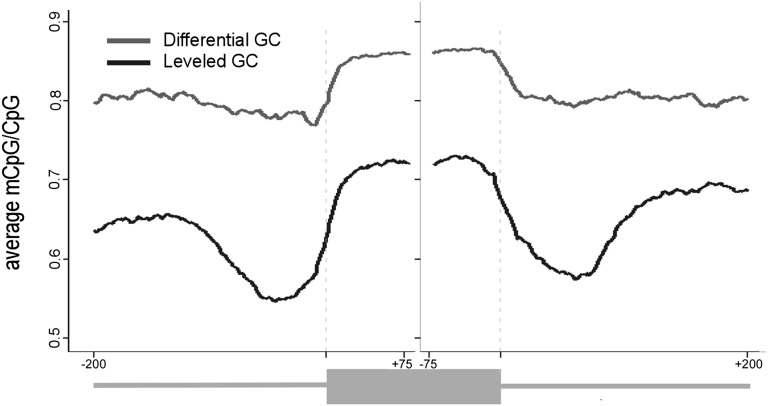
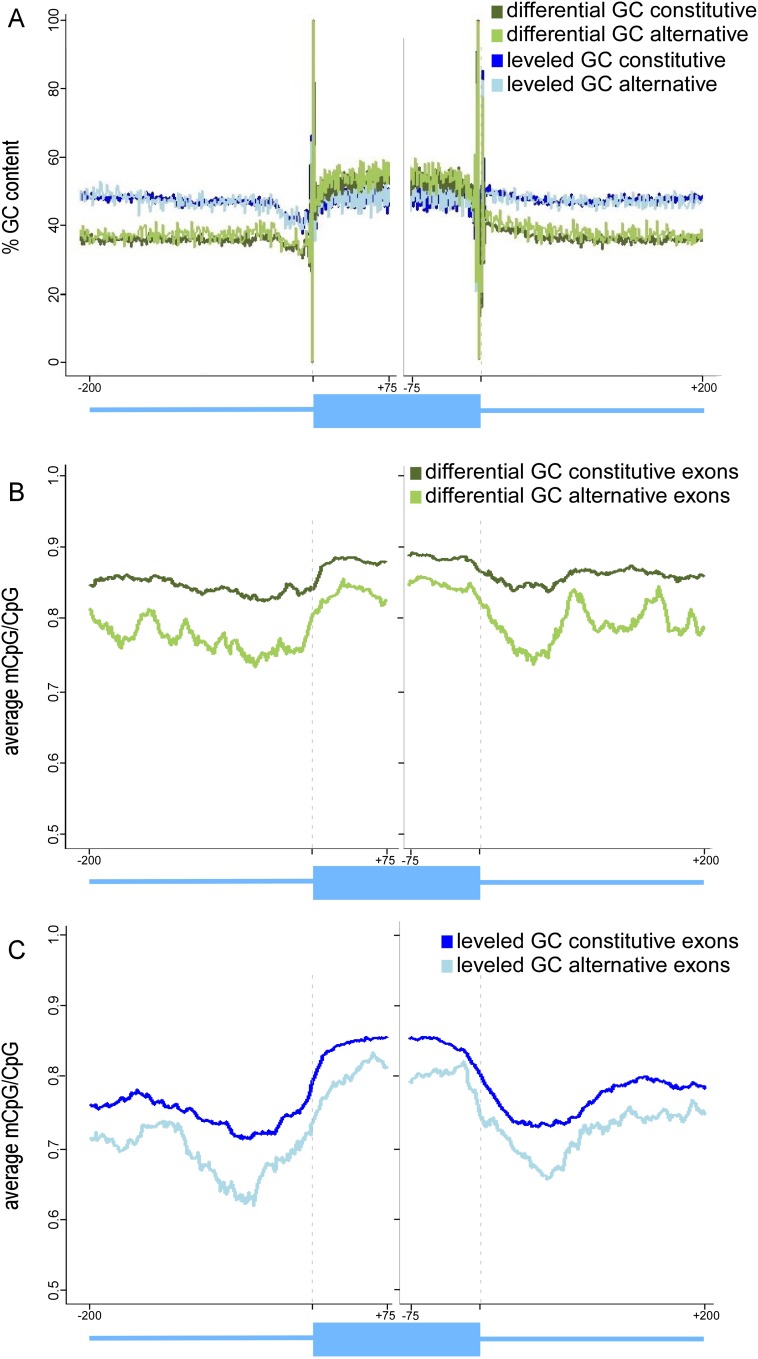
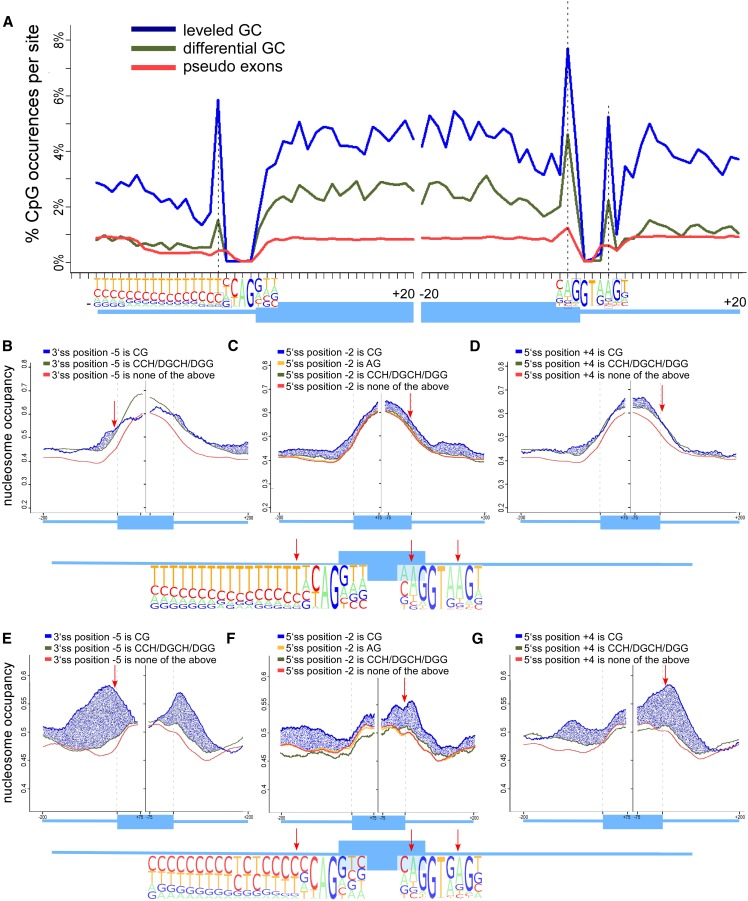
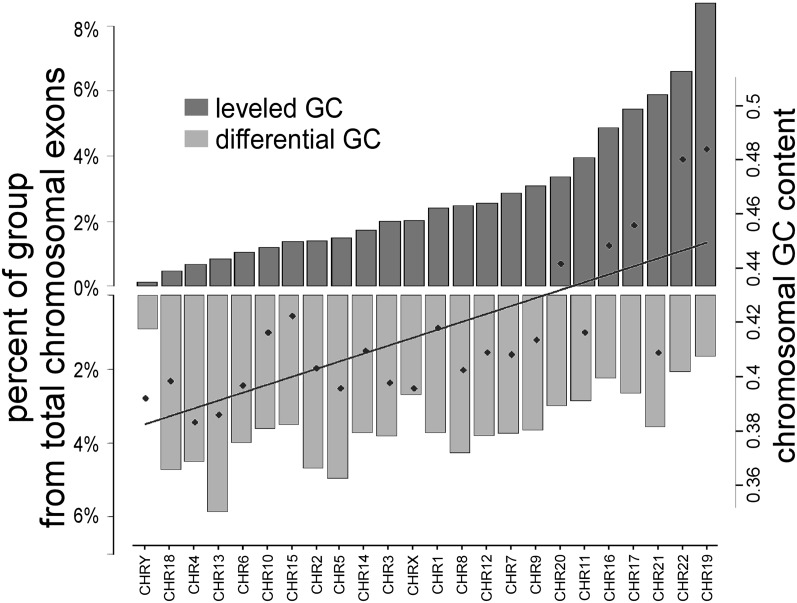
DNA methylation is known to regulate transcription and was recently found to be involved in exon recognition via cotranscriptional splicing. We recently observed that exon-intron architectures can be grouped into two classes: one with higher GC content in exons compared to the flanking introns, and the other with similar GC content in exons and introns. The first group has higher nucleosome occupancy on exons than introns, whereas the second group exhibits weak nucleosome marking of exons, suggesting another type of epigenetic marker distinguishes exons from introns when GC content is similar. We find different and specific patterns of DNA methylation in each of the GC architectures; yet in both groups, DNA methylation clearly marks the exons. Exons of the leveled GC architecture exhibit a significantly stronger DNA methylation signal in relation to their flanking introns compared to exons of the differential GC architecture. This is accentuated by a reduction of the DNA methylation level in the intronic sequences in proximity to the splice sites and shows that different epigenetic modifications mark the location of exons already at the DNA level. Also, lower levels of methylated CpGs on alternative exons can successfully distinguish alternative exons from constitutive ones. Three positions at the splice sites show high CpG abundance and accompany elevated nucleosome occupancy in a leveled GC architecture. Overall, these results suggest that DNA methylation affects exon recognition and is influenced by the GC architecture of the exon and flanking introns.


Figures

Figure 1.
Figure 1.
DNA-methylation levels in exons and flanking introns that differ by their GC content. Average of methylated CpGs along exon–intron structure with a differential GC content between the intron and the exon (gray) and along exon–intron structure in which the GC content is identical between the exon and the flanking introns (black). The average value was calculated per base for exons (75 nt from each splice site) and flanking intronic regions (200 nt). A running average of 20 was applied after omitting the following positions for having no CpG occurrences: 3′ss positions −4 to −1 and 5′ss positions +1 and +2.
Figure 2.
Figure 2.
Average of methylated CpGs and GC content of constitutive and alternative exons. (A) Average of GC content percentage of differential GC content constitutive exons (dark green) and alternative exons (bright green) and of leveled GC content constitutive exons (dark blue) and alternative exons (bright blue). (B) Average of methylated CpGs of differential GC content constitutive exons (dark green) and alternative exons (bright green). (C) Average of methylated CpGs for leveled GC content constitutive exons (dark blue) and alternative exons (bright blue). The average value was calculated per base for exons (75 nt from each splice site) and flanking intronic regions (200 nt). A running average of 20 was applied for mCpG values after omitting the following positions for having no CpG occurrences: 3′ splice site positions −4 to −1 and 5′ splice site positions +1 and +2.
Figure 3.
Figure 3.
CpG-abundance peaks at splice sites and their effect on nucleosome occupancy. (A) Percentage of methylated CpGs around the 3′ and 5′ splice sites of the differential GC exon–intron group (green), leveled GC content exon–intron group (blue), and pseudo exons (red). The percentage was calculated per base for exons (20 nt from each splice site) and flanking intronic regions (20 nt), and the number of exons with a CpG at each position was divided by total exons. The structure of the exon–intron junctions are shown in the bottom with pictogram depictions of the splice sites based on Gelfman et al. (2012). Specific positions with high levels of DNA methylation are marked in black boxes and dashed lines. (B–D) Average per base nucleosome occupancy levels for differential GC exons. Nucleosome occupancy levels are presented for three positions within the splice sites: (B) position −5 of the 3′ splice site; (C) position −2 of the 5′ splice site; and (D) position +4 of the 5′ splice site. Nucleosome occupancy levels are given based on dinucleotide composition: (1) CG dinucleotides (blue); (2) CCH/DGCH/DGG (green); and (3) any other composition (red). Position −2 of the 5′ splice site is compared to the AG dinucleotide composition, which represents the consensus dinucleotide at this position. Structure of the differential GC exon–intron junctions are shown in the bottom of these panels with pictogram depictions of the splice sites. (E–G) Average per base nucleosome occupancy levels for leveled GC exons. Nucleosome occupancy levels are presented for three positions within the splice sites: (E) position −5 of the 3′ splice site; (F) position −2 of the 5′ splice site; and (G) position +4 of the 5′ splice site. Structure of the leveled GC exon–intron junctions are shown in the bottom of these panels with pictogram depictions of the splice sites.
Figure 4.
Figure 4.
Distribution of differential and leveled GC exons by chromosomal location. Genomic distribution by chromosome of differential GC (light gray) and leveled GC (dark gray) exons. The left y-axis represents the percentage of each group in each chromosome. The right y-axis represents the general GC content of the chromosomes.

References

    1. Amit M, Donyo M, Hollander D, Goren A, Kim E, Gelfman S, Lev-Maor G, Burstein D, Schwartz S, Postolsky B 2012. Differential GC content between exons and introns establishes distinct strategies of splice-site recognition. Cell Rep 1: 543–556 - PubMed
    1. Anastasiadou C, Malousi A, Maglaveras N, Kouidou S 2011. Human epigenome data reveal increased CpG methylation in alternatively spliced sites and putative exonic splicing enhancers. DNA Cell Biol 30: 267–275 - PubMed
    1. Andersson R, Enroth S, Rada-Iglesias A, Wadelius C, Komorowski J 2009. Nucleosomes are well positioned in exons and carry characteristic histone modifications. Genome Res 19: 1732–1741 - PMC - PubMed
    1. Batsché E, Yaniv M, Muchardt C 2006. The human SWI/SNF subunit Brm is a regulator of alternative splicing. Nat Struct Mol Biol 13: 22–29 - PubMed
    1. Bernardi G, Olofsson B, Filipski J, Zerial M, Salinas J, Cuny G, Meunier-Rotival M, Rodier F 1985. The mosaic genome of warm-blooded vertebrates. Science 228: 953–958 - PubMed

Publication types