Regulation of several androgen-induced genes through the repression of the miR-99a/let-7c/miR-125b-2 miRNA cluster in prostate cancer cells
- PMID: 23503464
- PMCID: PMC3915043
- DOI: 10.1038/onc.2013.77
Regulation of several androgen-induced genes through the repression of the miR-99a/let-7c/miR-125b-2 miRNA cluster in prostate cancer cells
Abstract
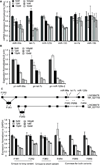
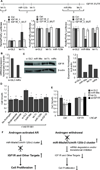
The androgen receptor (AR) stimulates and represses gene expression to promote the initiation and progression of prostate cancer. Here, we report that androgen represses the miR-99a/let7c/125b-2 cluster through AR and anti-androgen drugs block the androgen-repression of the miRNA cluster. AR directly binds to the host gene of the miR-99a/let7c/125b-2 cluster, LINC00478. Expression of the cluster is repressed or activated by chromatin remodelers EZH2 or JMJD3 in the presence or absence of androgen, respectively. Bioinformatics analysis reveals a significant enrichment of targets of miR-99a, let-7c and miR-125b in androgen-induced gene sets, suggesting that downregulation of the miR-99a/let7c/125b-2 cluster by androgen protects many of their target mRNAs from degradation and indirectly assists in the gene induction. We validated the hypothesis with 12 potential targets of the miR-99a/let7c/125b-2 cluster induced by androgen: 9 out of the 12 mRNAs are downregulated by the microRNA cluster. To ascertain the biological significance of this hypothesis, we focused on IGF1R, a known prostate cancer growth factor that is induced by androgen and directly targeted by the miR-99a/let7c/125b-2 cluster. The androgen-induced cell proliferation is ameliorated to a similar extent as anti-androgen drugs by preventing the repression of the microRNAs or induction of IGF1R in androgen-dependent prostate cancer cells. Expression of a microRNA-resistant form of IGF1R protects these cells from inhibition by the miR-99a/let7c/125b-2 cluster. These results indicate that a thorough understanding of how androgen stimulates prostate cancer growth requires not only an understanding of genes directly induced/repressed by AR, but also of genes indirectly induced by AR through the repression of key microRNAs.
Conflict of interest statement
The authors declare no conflict of interest.
Figures


Similar articles
-
Genome-wide screen identified let-7c/miR-99a/miR-125b regulating tumor progression and stem-like properties in cholangiocarcinoma.Oncogene. 2016 Jun 30;35(26):3376-86. doi: 10.1038/onc.2015.396. Epub 2015 Oct 12. Oncogene. 2016. PMID: 26455324 Free PMC article.
-
Slow Transcription of the 99a/let-7c/125b-2 Cluster Results in Differential MiRNA Expression and Promotes Melanoma Phenotypic Plasticity.J Invest Dermatol. 2021 Dec;141(12):2944-2956.e6. doi: 10.1016/j.jid.2021.03.036. Epub 2021 Jun 26. J Invest Dermatol. 2021. PMID: 34186058
-
Systematic analysis of berberine-induced signaling pathway between miRNA clusters and mRNAs and identification of mir-99a ∼ 125b cluster function by seed-targeting inhibitors in multiple myeloma cells.RNA Biol. 2015;12(1):82-91. doi: 10.1080/15476286.2015.1017219. RNA Biol. 2015. PMID: 25826415 Free PMC article.
-
Androgen receptor and miR-206 regulation in prostate cancer.Transcription. 2017;8(5):313-327. doi: 10.1080/21541264.2017.1322668. Epub 2017 Jun 9. Transcription. 2017. PMID: 28598253 Free PMC article. Review.
-
Good guy or bad guy: the opposing roles of microRNA 125b in cancer.Cell Commun Signal. 2014 Apr 28;12:30. doi: 10.1186/1478-811X-12-30. Cell Commun Signal. 2014. PMID: 24774301 Free PMC article. Review.
Cited by
-
MicroRNA-99a Suppresses Breast Cancer Progression by Targeting FGFR3.Front Oncol. 2020 Jan 24;9:1473. doi: 10.3389/fonc.2019.01473. eCollection 2019. Front Oncol. 2020. PMID: 32038996 Free PMC article.
-
The Mechanism of Synchronous Precise Regulation of Two Shrimp White Spot Syndrome Virus Targets by a Viral MicroRNA.Front Immunol. 2017 Nov 27;8:1546. doi: 10.3389/fimmu.2017.01546. eCollection 2017. Front Immunol. 2017. PMID: 29230209 Free PMC article.
-
MiR-99a-5p up-regulates LDLR and functionally enhances LDL-C uptake via suppressing PCSK9 expression in human hepatocytes.Front Genet. 2024 Nov 19;15:1469094. doi: 10.3389/fgene.2024.1469094. eCollection 2024. Front Genet. 2024. PMID: 39628814 Free PMC article.
-
The roles of microRNAs in the progression of castration-resistant prostate cancer.J Hum Genet. 2017 Jan;62(1):25-31. doi: 10.1038/jhg.2016.69. Epub 2016 Jun 9. J Hum Genet. 2017. PMID: 27278789 Review.
-
Human Prostate Tissue MicroRNAs and Their Predicted Target Pathways Linked to Prostate Cancer Risk Factors.Cancers (Basel). 2021 Jul 15;13(14):3537. doi: 10.3390/cancers13143537. Cancers (Basel). 2021. PMID: 34298752 Free PMC article.
References
-
- Richter E, Srivastava S, Dobi A. Androgen receptor and prostate cancer. Prostate Cancer Prostatic Dis. 2007;10(2):114–118. - PubMed
-
- Takayama K, Kaneshiro K, Tsutsumi S, Horie-Inoue K, Ikeda K, Urano T, et al. Identification of novel androgen response genes in prostate cancer cells by coupling chromatin immunoprecipitation and genomic microarray analysis. Oncogene. 2007;26(30):4453–4463. - PubMed
Publication types
MeSH terms
Substances
Grants and funding
LinkOut - more resources
Full Text Sources
Other Literature Sources
Medical
Research Materials

