

Next-generation museomics disentangles one of the largest primate radiations
- PMID: 23503595
- PMCID: PMC3676678
- DOI: 10.1093/sysbio/syt018
Next-generation museomics disentangles one of the largest primate radiations
Abstract
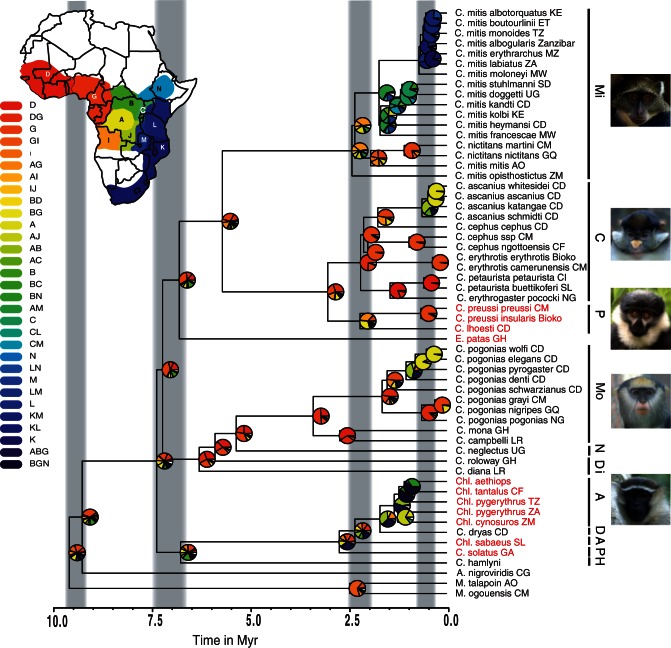
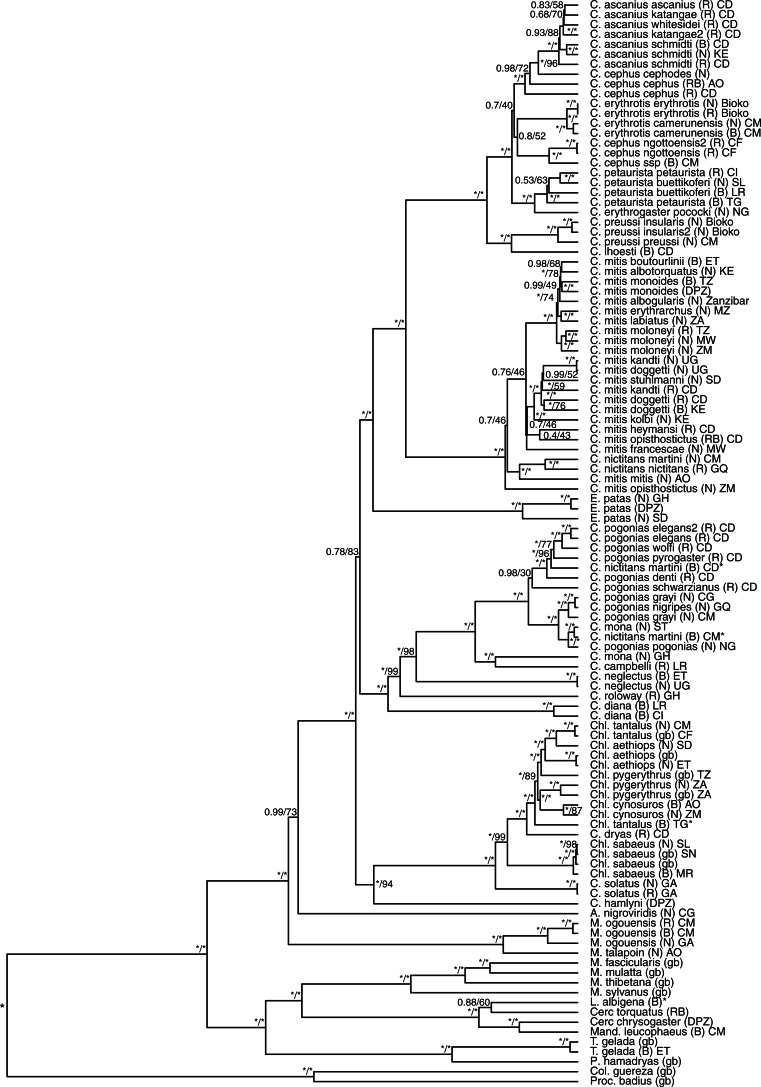
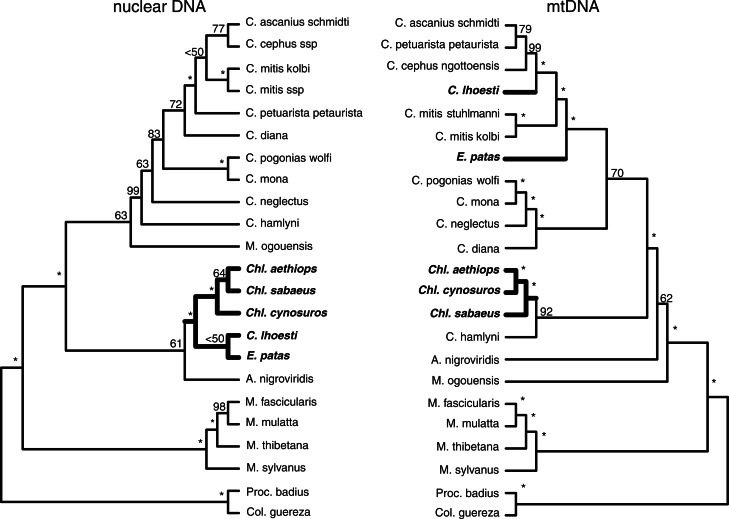
Guenons (tribe Cercopithecini) are one of the most diverse groups of primates. They occupy all of sub-Saharan Africa and show great variation in ecology, behavior, and morphology. This variation led to the description of over 60 species and subspecies. Here, using next-generation DNA sequencing (NGS) in combination with targeted DNA capture, we sequenced 92 mitochondrial genomes from museum-preserved specimens as old as 117 years. We infer evolutionary relationships and estimate divergence times of almost all guenon taxa based on mitochondrial genome sequences. Using this phylogenetic framework, we infer divergence dates and reconstruct ancestral geographic ranges. We conclude that the extraordinary radiation of guenons has been a complex process driven by, among other factors, localized fluctuations of African forest cover. We find incongruences between phylogenetic trees reconstructed from mitochondrial and nuclear DNA sequences, which can be explained by either incomplete lineage sorting or hybridization. Furthermore, having produced the largest mitochondrial DNA data set from museum specimens, we document how NGS technologies can "unlock" museum collections, thereby helping to unravel the tree-of-life.
Figures

References
-
- Aldrich-Blake F.P.G. A fertile hybrid between two Cercopithecus species in the Budongo Forest, Uganda. Folia Primatol. 1968;9:15–21. - PubMed
-
- Arnold M.L., Meyer A. Natural hybridization in primates: one evolutionary mechanism. Zoology. 2006;109:261–276. - PubMed
-
- Barraclough T.G., Vogler A.P. Detecting the geographical pattern of speciation from species-level phylogenies. Am. Nat. 2000;155:419–434. - PubMed
-
- Benefit B.R., McCrossin M.L., Boaz N.T., Pavlakis P. New fossil Cercopithecoids from the Late Miocene of As Sahabi, Libya. Garyounis Sci. Bull. 2008;5:265–282. Special Issue, No.
-
- Benefit B.R., Pickford M. Miocene fossil Cercopithecoids from Kenya. Am. J. Phys. Anthropol. 1986;69:441–464.
Publication types
MeSH terms
Substances
Associated data
- Actions
- Actions
- Actions
- Actions
- Actions
- Actions
- Actions
- Actions
- Actions
- Actions
- Actions
- Actions
- Actions
- Actions
- Actions
- Actions
- Actions
- Actions
- Actions
- Actions
- Actions
- Actions
- Actions
- Actions
- Actions
- Actions
- Actions
- Actions
- Actions
- Actions
- Actions
- Actions
- Actions
- Actions
- Actions
- Actions
- Actions
- Actions
- Actions
- Actions
- Actions
- Actions
- Actions
- Actions
- Actions
- Actions
- Actions
- Actions
- Actions
- Actions
- Actions
- Actions
- Actions
- Actions
- Actions
- Actions
- Actions
- Actions
- Actions
- Actions
- Actions
- Actions
- Actions
- Actions
- Actions
- Actions
- Actions
- Actions
- Actions
- Actions
- Actions
- Actions
- Actions
- Actions
- Actions
- Actions
- Actions
- Actions
- Actions
- Actions
- Actions
- Actions
- Actions
- Actions
- Actions
- Actions
- Actions
- Actions
- Actions
- Actions
- Actions
- Actions
- Actions
LinkOut - more resources
Full Text Sources
Other Literature Sources
