. 2013 Apr;31(4):342-9.
doi: 10.1038/nbt.2519. Epub 2013 Mar 17.

Deciphering molecular circuits from genetic variation underlying transcriptional responsiveness to stimuli

Affiliations

Deciphering molecular circuits from genetic variation underlying transcriptional responsiveness to stimuli

Irit Gat-Viks et al. Nat Biotechnol. 2013 Apr.

Abstract

Individual genetic variation affects gene responsiveness to stimuli, often by influencing complex molecular circuits. Here we combine genomic and intermediate-scale transcriptional profiling with computational methods to identify variants that affect the responsiveness of genes to stimuli (responsiveness quantitative trait loci or reQTLs) and to position these variants in molecular circuit diagrams. We apply this approach to study variation in transcriptional responsiveness to pathogen components in dendritic cells from recombinant inbred mouse strains. We identify reQTLs that correlate with particular stimuli and position them in known pathways. For example, in response to a virus-like stimulus, a trans-acting variant responds as an activator of the antiviral response; using RNA interference, we identify Rgs16 as the likely causal gene. Our approach charts an experimental and analytic path to decipher the mechanisms underlying genetic variation in circuits that control responses to stimuli.


Figures

Figure 1
Figure 1. Multi-stimulus reQTL analysis
(a) Shown are responsiveness traits (grey) and genetic associations (orange) for stimulus non-specific (left) and stimulus-specific (right) reQTLs in each of three stimuli (s1, s2, s3). Stimulus-specificity is determined by comparing the stimuli in which the gene is responsive (grey) to the stimuli in which this responsiveness is associated with the genetic variants (orange). (b-c) Shown is a conceptual scheme for relating genetic variants (black filled circles) to branches in molecular circuits (black lines) in the context of multiple stimuli (s1, s2, s3), based on considering the stimuli in which we observe responsiveness traits (grey) in genes (x1, x2, x3, x4) and the stimuli in which those traits are associated with the genetic variants (orange). (b) Positioning trans-reQTLs. The position of reQTL I in branch 2 is consistent with its activity only in stimulus s2 and with its effect on gene x1, which responds to both s1 and s2. The position of reQTL II in branch 6 is consistent with its activity in both stimuli s2 and s3 and with its effect on gene x2, which responds to both stimuli. (c) Positioning cis-reQTLs. The cis-reQTL I interacts with factors from a branch stimulated by s2 only, whereas cis-reQTL II responds to factors affected by both s2 and s3.
Figure 2
Figure 2. Experimental design of the study in DCs
(a) Overview of step-wise study design applied here to the TLR circuit in DCs. Blue text indicates new computational methods. (b) A schematic map of the TLR circuit under study, consisting of three agonists (PAM, poly IC and LPS), their cognate receptors (TLR2, TLR3 and MDA5, and TLR4), branches propagating the signal through transcription factors such as NF-κB and Irf3 or STAT (rounded gray rectangles) and downstream target genes (white rectangles, bottom). (c) Shown is the expression of 799significantly scoring genes (rows) in DCs from the D2 parental strain (left) and in each parental and 6 inbred BXD strains (right) after stimulation for the indicated time periods with pathogen components; 2 individuals of each strain are shown consecutively. Expression values are log fold changes relative to the B6 strain at the same condition (red/blue color scale); a total of 30 arrays were used (Supplementary Table 1). Genes were clustered into distinct classes based on the InSignature algorithm; class separation is indicated by horizontal lines (left column); singleton classes are labeled. (d) Same as (c) but showing only the 322 representative genes chosen by InSignature (out of the 799 genes in (c)) to be included in the variation signature.
Figure 3
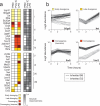
Figure 3. cis-reQTLs in the response of DCs to three pathogenic components
(a) Shown are heatmaps of cis-association profiles (left; high likelihood ratio (LR) scores - colored; low LR scores – white) and of responsiveness profiles (right; dark grey: high responsiveness, white: low responsiveness) for all genes (rows) that are cis-associated in at least one stimulus (columns). The genes are split into eight groups (I-VIII) based on the combination of responsiveness and association profiles. (b) Shown are expression profiles (y axis) at three time points following LPS stimulation (x axis) of genes representing different association classes: early divergence (St3gal5), late divergence (Nmi), convergence (Trim12) and inversion (Rnd3). Depicted are profiles of B6, D2, and 44 BXD strains; Black and grey denote whether the strain carries B6 or D2 alleles in the proximity of the gene of interest.
Figure 4
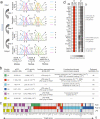
Figure 4. Stimulus-specific pleiotropic trans-acting reQTLs
(a) Illustration of the InVamod hierarchical reconstruction procedure for trans-reQTL analysis. InVamod starts (top) with association scores (y-axis) of traits (t1-t9, marked) at each genomic position (x-axis). Dashed lines are significance cutoffs for single, double and triple trait modules (c1=4, c2=2, c3=1.5, respectively). First, InVamod initializes modules (top): t1, t3, t4, and t6 form four seed modules associated at positions A, C, D and E, respectively. Other traits do not exceed c1 at any position. Each module is denoted by its associated genetic variant (vertical red lines) and is color-coded (A-blue, C-orange, D-green, E-purple). Next, InVamod constructs modules hierarchically by merging traits and updating the genetic variants to the new module (Methods). In this illustrative example in step 1: Module A and t2 merged and the new module remains associated at A (as per Supplementary Fig. 4a); in step 2: Modules C and D merged (as per Supplementary Fig. 4b) and associated with a new genetic variant F; in step 3: Module F and t5 merged, and the merged module remains associated at F. Other traits, such as t7, t8, t9 and Module E cannot be legally merged (as per Supplementary Fig. 4c). InVamod outputs (bottom) three modules consisting of 2, 1 and 3 traits that are associated with genetic variants A, E, and F, respectively. (b) Co-variation modules. Shown are key characteristics for the six significant modules identified by InVamod. (c) Association profiles of genes (columns) in each variation module. Module association is indicated by the color code in column 1 in (b). cis-linked traits are omitted. (d) Shown are the association profiles (left, red denotes associated) of the genes (rows) in module #2 and their responsiveness profiles (right, grey denotes responsiveness). Distinct responsiveness profiles (RPs) are marked on the right. Genes that are not associated under poly IC or are associated with additional modules are excluded for simplicity. Similar presentation of the other five modules is in Supplementary Fig. 5d.
Figure 5
Figure 5. Positioning reQTLs in regulatory circuits
(a) Illustration of the InCircuit algorithm. For details see Supplementary Fig. 6. (b) InCircuit's positioning five reQTLs (colored circuits) in the TLR molecular circuit. Solid edges: branches of the input circuit, adapted from previous reports. Target genes of each module (filled colored squares at bottom, color coded as in Fig. 4b) are arranged by their responsiveness profiles (as detailed in Supplementary Fig. 5d) downstream of transcription factors (TF, rounded gray rectangles). Dashed edge: new branch required to reconcile our data with the existing molecular circuit diagram. (c) Shown is a signaling network of a TLR circuit (adapted from previous reports, ) with the predicted positions of the trans-reQTLs for module #1 (green oval) and #2 (red oval) based on InCircuit's analysis of (b). Module #1 and #2 genes are positioned under either IRF/STAT or NF-κB based on promoter analysis, and color-coded as in Fig. 4b. If a gene is a member of both module #1 and #2 it is indicated with both colors. Dashed colored arrows connect each reQTL to its target genes.
Figure 6
Figure 6. Rgs16 may be the causal variant in the module #2 reQTL
(a) Module #2 reQTL in Chr1: 129-165Mb. Shown is the LR score (Y axis) across the chromosome 1 genomic position (x-axis) for LPS responsiveness traits in eight module #2 genes. The positions of the nine candidate causal variants in this interval are marked below the x-axis. (b) Effect of shRNAs specific for each of the nine candidate causal variants (2 shRNAs for Rgs16 were used) or control shRNA on responsiveness of module #2 genes in SeV-infected DCs. Y-axis indicates the -log P-value of t-test (Methods) (black bars, left y-axis), as well as the extent of knockdown (+ marks, right y-axis) caused by each shRNA. (c) Effect of Rgs16 shRNA #1 on abundance of transcripts encoding module #2 genes or negative control genes (log2(transcript level in Rgs16 shRNA vs. its level in Luciferase and LacZ shRNA), averaged across a B6 and D2 individuals; Methods) in different stimulation conditions (6h after SeV infection, PAM, or LPS and no stimulation (baseline)). Positive/negative values indicate increased/decreased transcript levels following Rgs16 shRNA treatment. In each box, the central mark is the median; edges are the 25th and 75th percentiles; whiskers extend to the most extreme data points not considered outliers; and outliers are plotted individually. **P<10-3.

References

    1. Smith EN, Kruglyak L. Gene-environment interaction in yeast gene expression. PLoS Biol. 2008;6:e83. - PMC - PubMed
    1. Heinig M, et al. A trans-acting locus regulates an anti-viral expression network and type 1 diabetes risk. Nature. 2010;467:460–464. - PMC - PubMed
    1. Zhong H, et al. Liver and adipose expression associated SNPs are enriched for association to type 2 diabetes. PLoS Genet. 2010;6:e1000932. - PMC - PubMed
    1. Barreiro LB, et al. Deciphering the genetic architecture of variation in the immune response to Mycobacterium tuberculosis infection. Proc Natl Acad Sci U S A. 2012;109:1204–1209. - PMC - PubMed
    1. Gargalovic PS, et al. Identification of inflammatory gene modules based on variations of human endothelial cell responses to oxidized lipids. Proc Natl Acad Sci U S A. 2006;103:12741–12746. - PMC - PubMed

Publication types

Associated data