. 2013 Apr 2;110(14):5600-5.
doi: 10.1073/pnas.1302641110. Epub 2013 Mar 15.

Primary aldosteronism and impaired natriuresis in mice underexpressing TGFβ1

Affiliations

Primary aldosteronism and impaired natriuresis in mice underexpressing TGFβ1

Masao Kakoki et al. Proc Natl Acad Sci U S A. .

Abstract

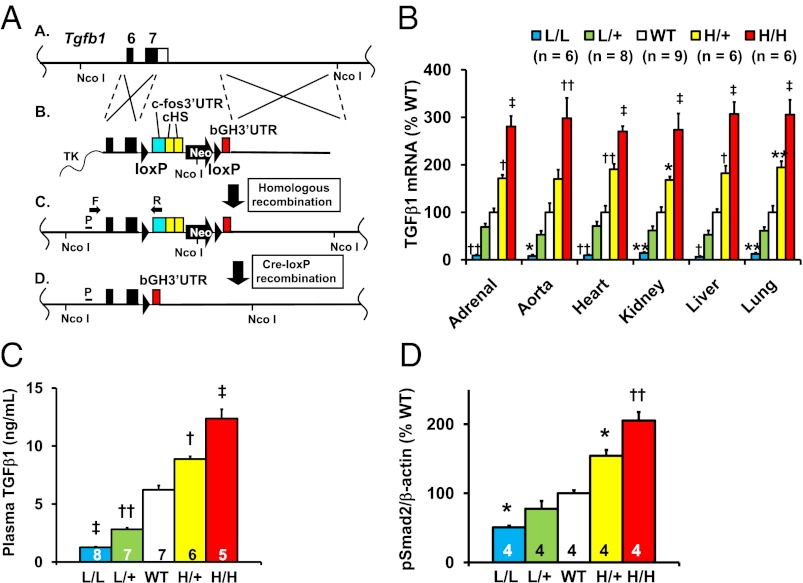
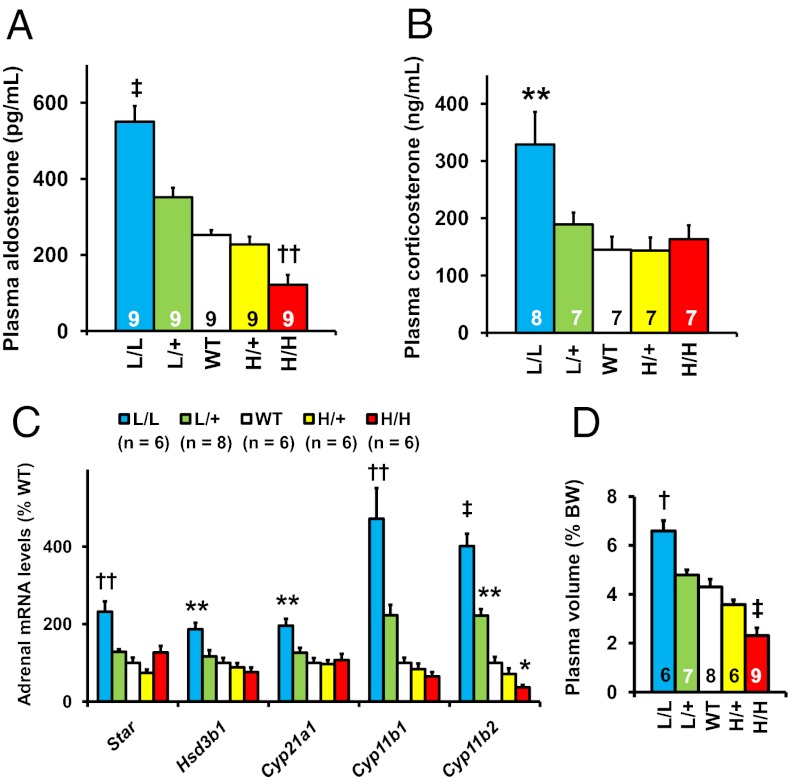
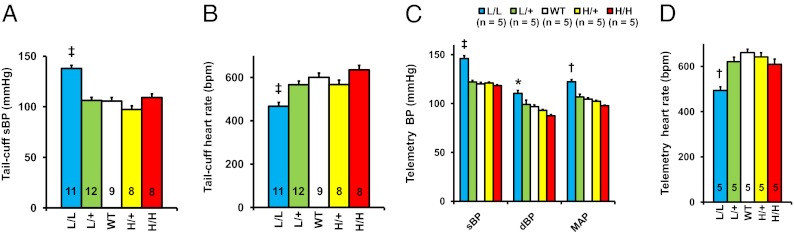
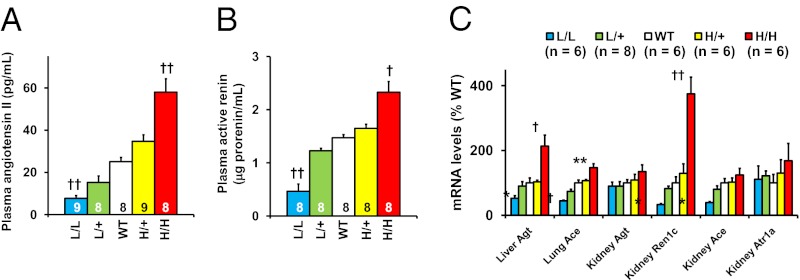
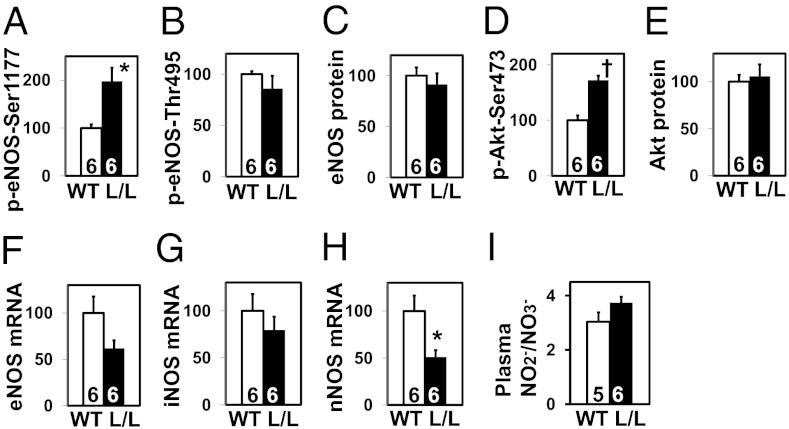
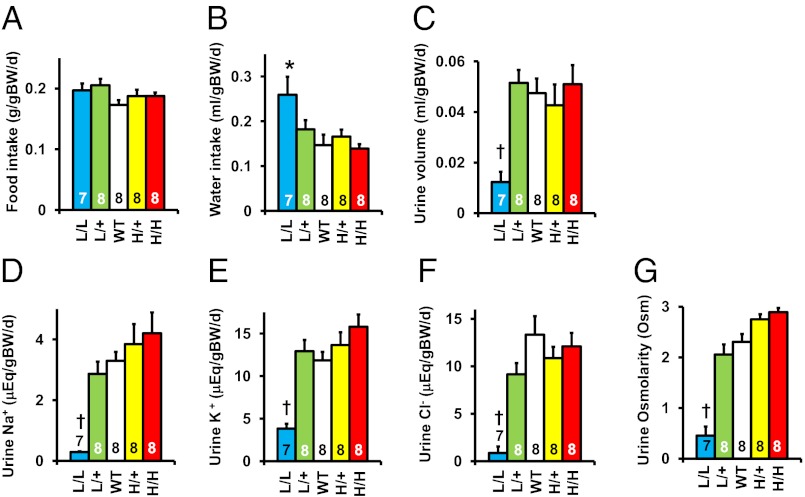
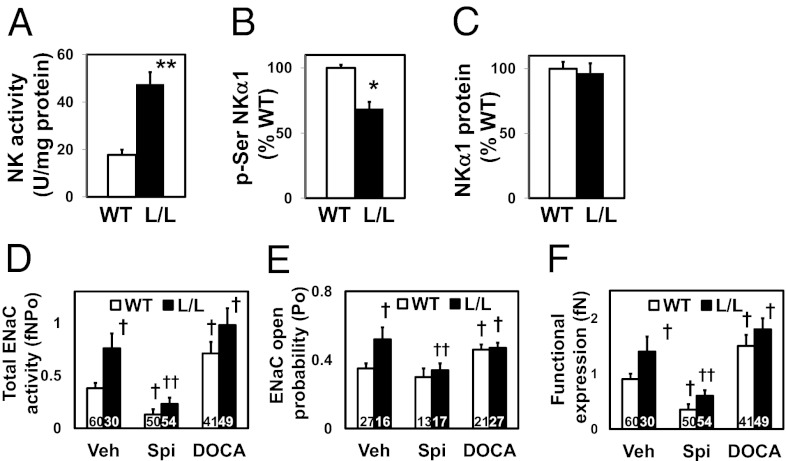
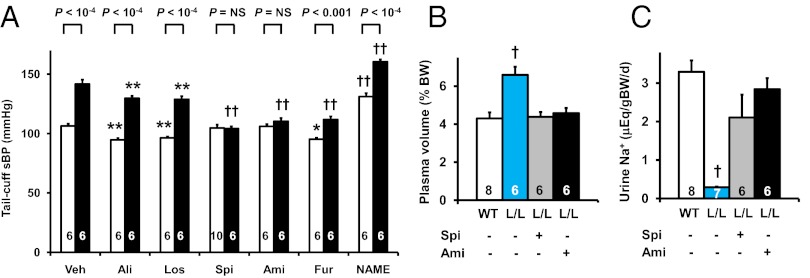
To uncover the potential cardiovascular effects of human polymorphisms influencing transforming growth factor β1 (TGFβ1) expression, we generated mice with Tgfb1 mRNA expression graded in five steps from 10% to 300% normal. Adrenal expression of the genes for mineralocorticoid-producing enzymes ranged from 50% normal in the hypermorphs at age 12 wk to 400% normal in the hypomorphs accompanied with proportionate changes in plasma aldosterone levels, whereas plasma volumes ranged from 50% to 150% normal accompanied by marked compensatory changes in plasma angiotensin II and renin levels. The aldosterone/renin ratio ranged from 0.3 times normal in the 300% hypermorphs to six times in the 10% hypomorphs, which have elevated blood pressure. Urinary output of water and electrolytes are markedly decreased in the 10% hypomorphs without significant change in the glomerular filtration rate. Renal activities for the Na(+), K(+)-ATPase, and epithelial sodium channel are markedly increased in the 10% hypomorphs. The hypertension in the 10% hypomorphs is corrected by spironolactone or amiloride at doses that do not change blood pressure in wild-type mice. Thus, changes in Tgfb1 expression cause marked progressive changes in multiple systems that regulate blood pressure and fluid homeostasis, with the major effects being mediated by changes in adrenocortical function.


Conflict of interest statement

The authors declare no conflict of interest.

Figures

Fig. 1.
Fig. 1.
Generation of mice having genetically graded expression of TGFβ1. L/L, Tgfb1L/L; L/+, Tgfb1L/+; WT, Tgfb1+/+; H/+, Tgfb1H/+; and H/H, Tgfb1H/H. *P < 0.05, **P < 0.01, P < 0.001, ††P < 10−4, P < 10−5 vs. WT. (A) The targeting strategy. (A, line A) The target locus is Tgfb1. Coding sequences and the endogenous 3′-UTR of the Tgfb1 gene are shown as black and white columns. (A, line B) The targeting vector contains a loxP sequence, the c-Fos 3′-UTR (blue), two copies of a transcriptional insulator (cHS) from the chicken β-globin gene (yellow), a Neo gene with the MC1 promoter (pMC1), loxP, and the 3′-UTR of the bovine growth hormone gene (bGH3′-UTR, red). The insulators minimize interference between the Tgfb1 promoter and pMC1. TK, thymidine kinase gene. (A, line C) The locus after homologous recombination. TGFβ1 expression is now controlled by the 3′-UTR of Fos [“low” (L) allele], which destabilizes the TGFβ1 mRNA and decreases TGFβ1 protein. (A, line D) The locus after Cre-lox P recombination. TGFβ1 expression is controlled by the 3′-UTR of bGH [“high” (H) allele], which stabilizes TGFβ1 mRNA and increases TGFβ1 protein. Gene targeting was confirmed by PCR with primers (F and R) and by a Southern blot (Fig. S2) with tail genomic DNA digested by Nco I radiolabeled with a probe (P). (B) The mRNA levels of TGFβ1 in different tissues in the five genotypes of 12-wk-old male mice. (C) Plasma concentrations of TGFβ1 in the five genotypes of 12-wk-old male mice. (D) Phosphorylated Smad2 in the hearts of 12-wk-old male mice of the five genotypes.
Fig. 2.
Fig. 2.
Adrenocortical function in the TGFβ1 hypo/hypermorphic mice at age 12 wk. *P < 0.05, **P < 0.01, P < 0.001, ††P < 10−4, P < 10−5 vs. WT. (A) Plasma aldosterone levels. (B) Plasma corticosterone levels. (C) The mRNA levels for enzymes required for aldosterone synthesis in the adrenal gland. (D) Plasma volume. BW, body weight.
Fig. 3.
Fig. 3.
Elevated arterial pressure and decreased heart rate in L/L male mice at age 12 wk. (A) Systolic blood pressure (sBP) in L/L, L/+, WT, H/+, and H/H mice determined with a tail-cuff method. P < 10−5 vs. WT. (B) Heart rate in the five genotypes of mice with a tail-cuff method. P < 10−5. (C) Systolic blood pressure (sBP), diastolic blood pressure (dBP), and mean arterial pressure (MAP) studied with telemetry in the five genotypes of mice. P < 10−5 vs. WT. (D) Heart rate in the five genotypes of mice with telemetry. ††P < 10−4 vs. WT.
Fig. 4.
Fig. 4.
Renin–angiotensin–aldosterone system in L/L, L/+, WT, H/+, and H/H male mice at age 12 wk. *P < 0.05, **P < 0.01, P < 0.001, ††P < 10−4 vs. WT. (A) Angiotensin II levels in the plasma. (B) Active renin concentration in the plasma. (C) Tissue mRNA levels for the components of renin–angiotensin system.
Fig. 5.
Fig. 5.
Nitric oxide (NO) system in the kidney of WT and L/L male mice at age 12 wk. *P < 0.05, P < 0.001 vs. WT. (A) Ser1177-phosphorylated endothelial NO synthase (eNOS; %WT). (B) Thr495-phosphorylated eNOS (%WT). (C) Total eNOS (%WT). (D) Ser473-phosphorylated Akt (%WT). (E) Total Akt (%WT). (F) eNOS mRNA levels (%WT). (G) Inducible NOS mRNA levels (%WT). (H) Neuronal NOS mRNA levels (%WT). (I) Plasma nitrite/nitrate (NO2/NO3) levels (μmol/L).
Fig. 6.
Fig. 6.
Metabolic study data in L/L, L/+, WT, H/+, and H/H male mice at age 12 wk. BW, body weight. *P < 0.05 vs. WT, P < 0.001 vs. WT. (A) Food consumption. (B) Water consumption. (C) Urine volume. (D) Urinary sodium excretion. (E) Urine potassium excretion. (F) Urinary chloride excretion. (G) Urine osmolarity.
Fig. 7.
Fig. 7.
Renal function in TGFβ1 hypomorphic mice. *P < 0.05, **P < 0.01 vs. WT. P < 0.05 vs. WT Veh; ††P < 0.05 vs. L/L Veh. (A) Renal activity of Na+-K+ ATPase (NK) studied by ouabain-sensitive conversion of ATP to inorganic phosphate. (B) Ser phosphorylation of NKα1. (C) Abundance of NKα1 protein. (D) Total ENaC activity in WT and L/L mice treated with vehicle (Veh), spironolactone (Spi; 50 mg/kg/d for 7 d), and DOCA (120 mg/kg/d for 3 d). (E) ENaC open probability (Po). (F) Functional ENaC expression (fN).
Fig. 8.
Fig. 8.
Pharmacological normalization of the hypertension of the Tgfb1 10% hypomorphs. (A) Systolic blood pressure (sBP) with a tail-cuff method in 12-wk-old WT (white columns) and L/L (black columns) mice administered vehicle (Veh), aliskiren (Ali; 40 mg/kg/d i.p.), losartan (Los; 10 mg/kg/d i.p.), spironolactone (Spi; 50 mg/kg/d i.p.), amiloride (Ami; 3 mg/kg/d i.p.), furosemide (Fur; 40 mg/kg/d i.p.), or Nω-nitro-L-arginine methyl ester (NAME; 30 mg/kg/d i.p.) for 2 wk. *P < 0.05, **P < 0.01, P < 0.001, ††P < 10−4 vs. the vehicle-treated group of the same genotype. NS, no significant difference. (B) Plasma volume in WT and L/L mice without and with spironolactone or amiloride. (C) Urinary sodium excretion. BW, body weight. P < 0.001 vs. WT.

References

    1. Cordenonsi M, et al. Links between tumor suppressors: p53 is required for TGF-beta gene responses by cooperating with Smads. Cell. 2003;113(3):301–314. - PubMed
    1. Derynck R, Akhurst RJ, Balmain A. TGF-beta signaling in tumor suppression and cancer progression. Nat Genet. 2001;29(2):117–129. - PubMed
    1. Zhou L, et al. TGF-beta-induced Foxp3 inhibits T(H)17 cell differentiation by antagonizing RORgammat function. Nature. 2008;453(7192):236–240. - PMC - PubMed
    1. Muraoka RS, et al. Blockade of TGF-beta inhibits mammary tumor cell viability, migration, and metastases. J Clin Invest. 2002;109(12):1551–1559. - PMC - PubMed
    1. Yang X, et al. Targeted disruption of SMAD3 results in impaired mucosal immunity and diminished T cell responsiveness to TGF-beta. EMBO J. 1999;18(5):1280–1291. - PMC - PubMed

Publication types

MeSH terms