

Semi-supervised multimodal relevance vector regression improves cognitive performance estimation from imaging and biological biomarkers
- PMID: 23504659
- PMCID: PMC3759235
- DOI: 10.1007/s12021-013-9180-7
Semi-supervised multimodal relevance vector regression improves cognitive performance estimation from imaging and biological biomarkers
Abstract
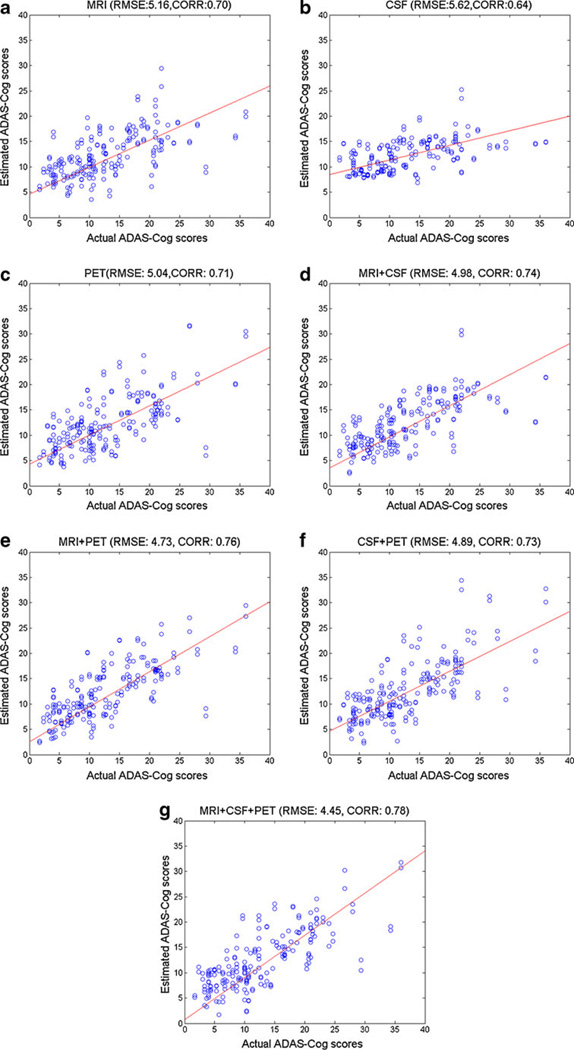
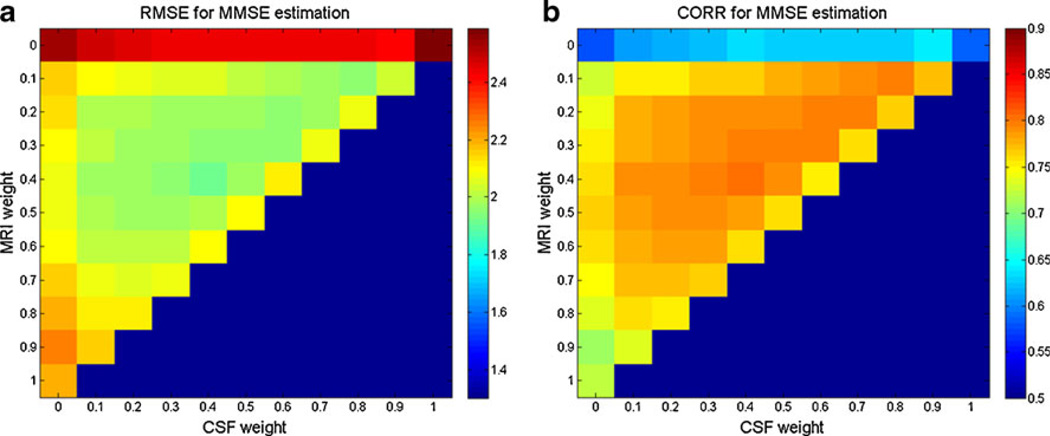
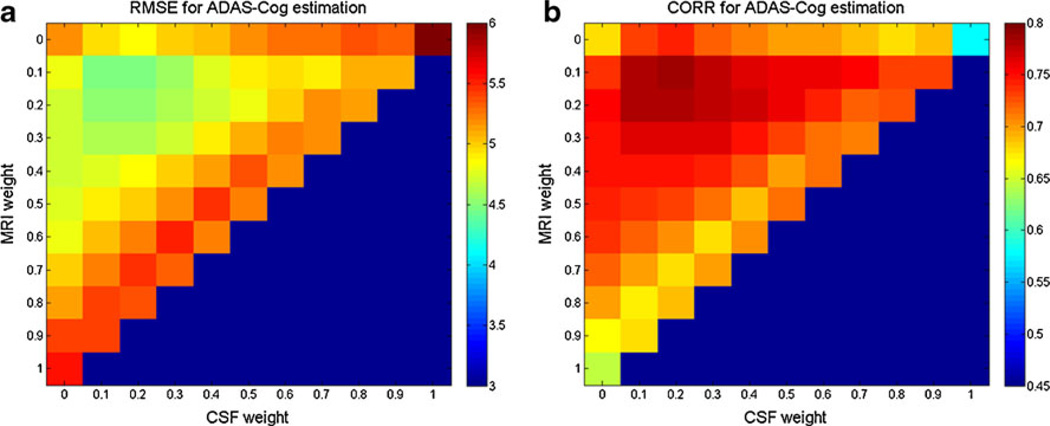
Accurate estimation of cognitive scores for patients can help track the progress of neurological diseases. In this paper, we present a novel semi-supervised multimodal relevance vector regression (SM-RVR) method for predicting clinical scores of neurological diseases from multimodal imaging and biological biomarker, to help evaluate pathological stage and predict progression of diseases, e.g., Alzheimer's diseases (AD). Unlike most existing methods, we predict clinical scores from multimodal (imaging and biological) biomarkers, including MRI, FDG-PET, and CSF. Considering that the clinical scores of mild cognitive impairment (MCI) subjects are often less stable compared to those of AD and normal control (NC) subjects due to the heterogeneity of MCI, we use only the multimodal data of MCI subjects, but no corresponding clinical scores, to train a semi-supervised model for enhancing the estimation of clinical scores for AD and NC subjects. We also develop a new strategy for selecting the most informative MCI subjects. We evaluate the performance of our approach on 202 subjects with all three modalities of data (MRI, FDG-PET and CSF) from the Alzheimer's Disease Neuroimaging Initiative (ADNI) database. The experimental results show that our SM-RVR method achieves a root-mean-square error (RMSE) of 1.91 and a correlation coefficient (CORR) of 0.80 for estimating the MMSE scores, and also a RMSE of 4.45 and a CORR of 0.78 for estimating the ADAS-Cog scores, demonstrating very promising performances in AD studies.
Figures


References
-
- Adams N. Semi-supervised learning. Journal of the Royal Statistical Society Series a-Statistics in Society. 2009;172:530–530.
-
- Belkin M, Niyogi P. Semi-supervised learning on Riemannian manifolds. Machine Learning. 2004;56:209–239.
-
- Belkin M, Matveeva I, Niyogi P. Regularization and semi-supervised learning on large graphs. Learning Theory, Proceedings. 2004;3120:624–638.
-
- Belkin M, Niyogi P, Sindhwani V. Manifold regularization: a geometric framework for learning from labeled and unlabeled examples. Journal of Machine Learning Research. 2006;7:2399–2434.
-
- Bouwman FH, Schoonenboom SN, van der Flier WM, van Elk EJ, Kok A, Barkhof F, et al. CSF biomarkers and medial temporal lobe atrophy predict dementia in mild cognitive impairment. Neurobiology of Aging. 2007;28:1070–1074. - PubMed
Publication types
MeSH terms
Substances
Grants and funding
LinkOut - more resources
Full Text Sources
Other Literature Sources
Medical
