. 2013 Apr;5(4):626-39.
doi: 10.1002/emmm.201202096. Epub 2013 Mar 18.

Fibroadipogenic progenitors mediate the ability of HDAC inhibitors to promote regeneration in dystrophic muscles of young, but not old Mdx mice

Affiliations

Fibroadipogenic progenitors mediate the ability of HDAC inhibitors to promote regeneration in dystrophic muscles of young, but not old Mdx mice

Chiara Mozzetta et al. EMBO Mol Med. 2013 Apr.

Abstract

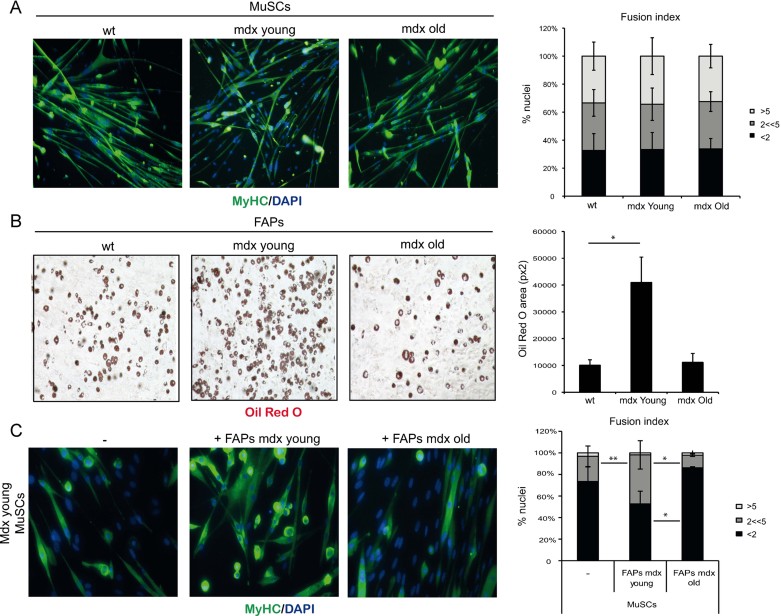
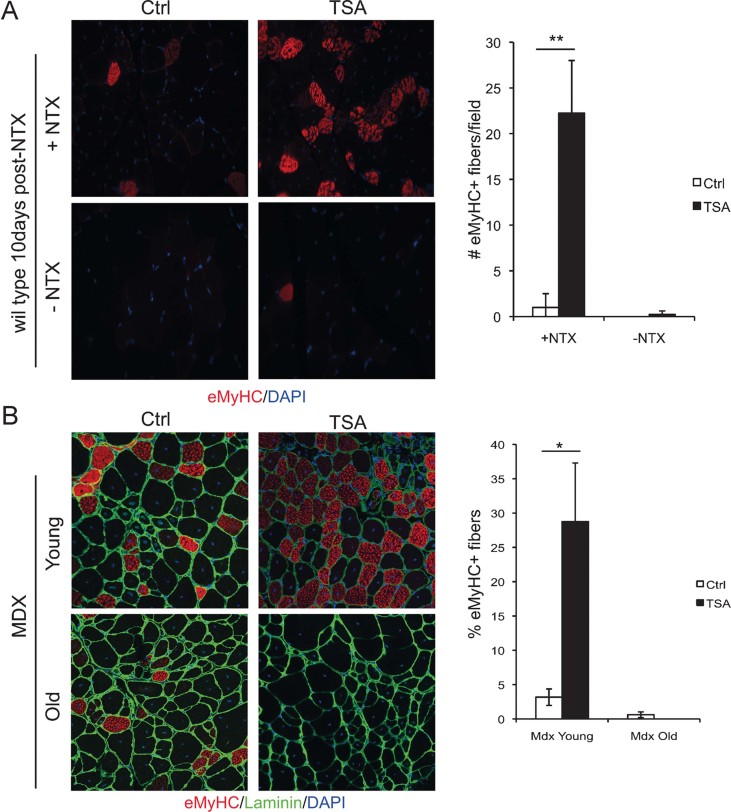
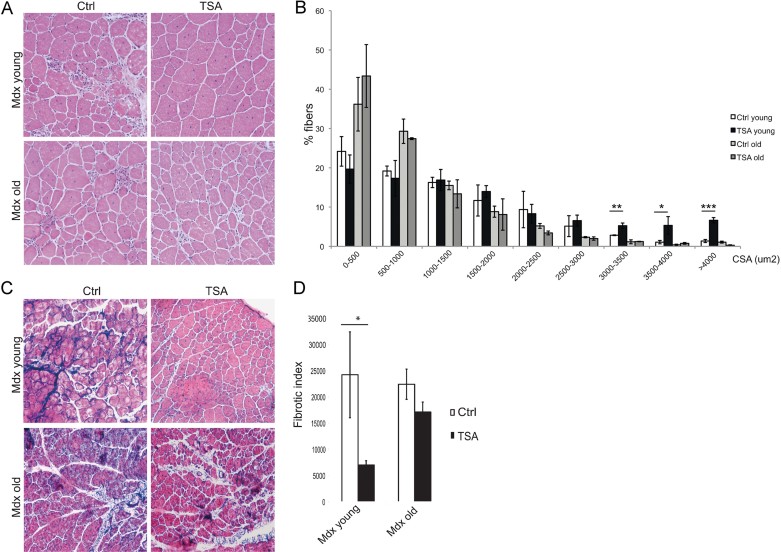
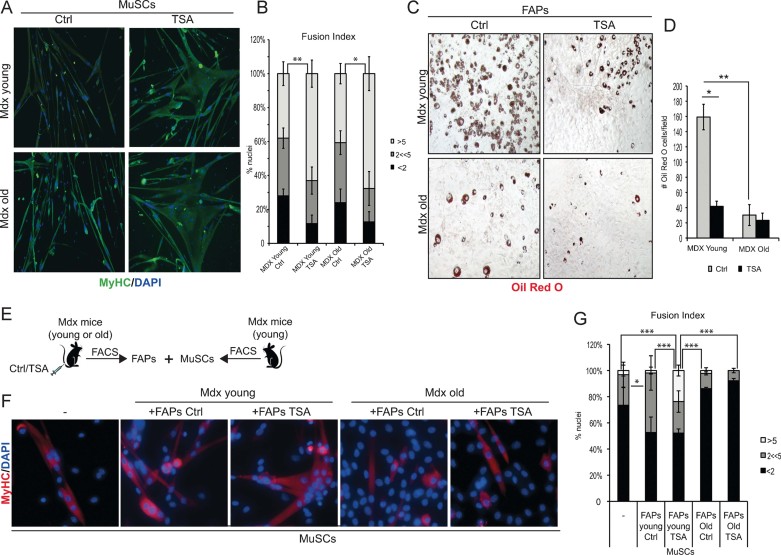
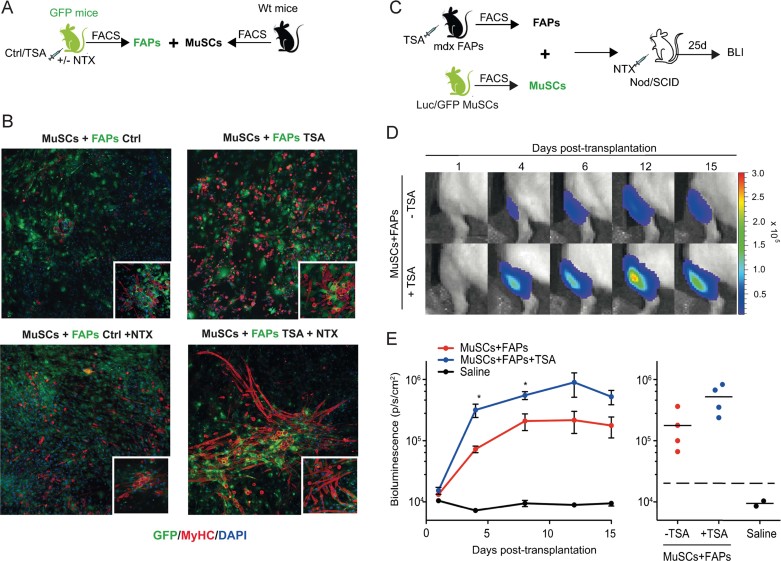
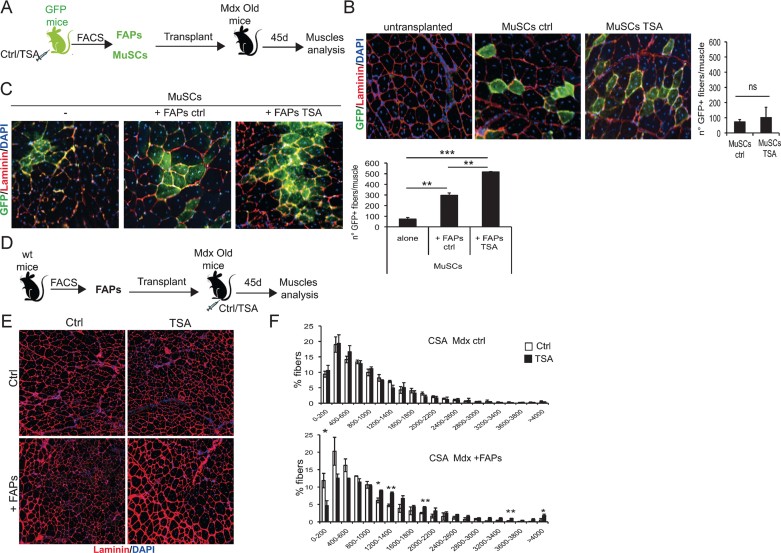
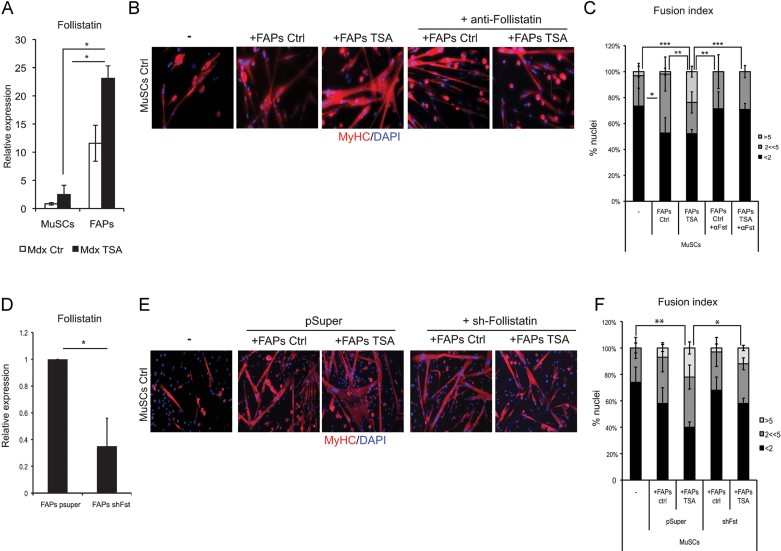
HDAC inhibitors (HDACi) exert beneficial effects in mdx mice, by promoting endogenous regeneration; however, the cellular determinants of HDACi activity on dystrophic muscles have not been determined. We show that fibroadipogenic progenitors (FAP) influence the regeneration potential of satellite cells during disease progression in mdx mice and mediate HDACi ability to selectively promote regeneration at early stages of disease. FAPs from young mdx mice promote, while FAPs from old mdx mice repress, satellite cell-mediated formation of myotubes. In young mdx mice HDACi inhibited FAP adipogenic potential, while enhancing their ability to promote differentiation of adjacent satellite cells, through upregulation of the soluble factor follistatin. By contrast, FAPs from old mdx mice were resistant to HDACi-mediated inhibition of adipogenesis and constitutively repressed satellite cell-mediated formation of myotubes. We show that transplantation of FAPs from regenerating young muscles restored HDACi ability to increase myofibre size in old mdx mice. These results reveal that FAPs are key cellular determinants of disease progression in mdx mice and mediate a previously unappreciated stage-specific beneficial effect of HDACi in dystrophic muscles.


Figures

Figure 1
Figure 1
Intrinsic differentiation potential and functional interactions between MuSCs and FAPs in MDX mice at different stages of disease. A. MuSCs isolated from hindlimbs muscles of wild type (wt) mice or mdx mice at early (mdx Young, 1.5-month old) or late (mdx Old, 12-month old) stages of disease progression (n = 3). Left panel: the myogenic potential of MuSCs was assessed by MyHC immunofluorescence. Representative images of MyHC (green) staining are shown. Nuclei were counterstained with DAPI (blue). Right panel: graph showing the quantification of fusion index. We measured the percentage of nuclei that were MyHC or MyHC+ in mononucleated myotubes (<2), the % of nuclei that were inside myotubes containing between 2 and 5 nuclei (2 << 5) and the % of nuclei inside myotubes containing more than five nuclei (>5). Data are represented as average ± SEM. B. FAPs were isolated from hindlimbs muscles of wild type (wt) mice or mdx mice at early (mdx Young, 1.5 month old) or late (mdx Old, 12 month old) stages of disease progression (n ≥ 3). Left panel: the adipogenic potential of FAPs was measured by Oil red O staining after 7 days of culture in growth medium and subsequent 6 days culture in adipogenic differentiation medium (adp-DM). Right panel: graph showing the quantification of red oil area, reported as pixel2/field. Data are represented as average ± SEM; statistical significance assessed by t-test, *p < 0.05. C. Left panel: The ability of FAPs, isolated from either young (middle panel) or old (right panel) mdx mice, to enhance MuSC ability to form myotubes was determined by MyHC staining after 7 days of co-culture in growth medium. Right panel: graph showing the quantification of fusion index. We measured the percentage of nuclei that were MyHC or MyHC+ in mononucleated myotubes (<2), the % of nuclei that were inside myotubes containing between 2 and 5 nuclei (2 << 5) and the % of nuclei inside myotubes containing more than 5 nuclei (>5). Data are represented as average ± SEM, (n = 3). Statistical significance tested by one-way ANOVA; *p < 0.05, **p < 0.01.
Figure 2
Figure 2
HDACi promote skeletal muscle regeneration only in actively regenerating muscles. A. Left panel: Right tibialis anterior of wild type mice were injured with notexin (+NTX) and the controlateral was left uninjured (−NTX). After 10 days of treatment with vehicle (Ctrl) or TSA, muscles were transverse sectioned and stained with an antibody against embryonal MyHC, (eMyHC – red) and nuclei counterstained with DAPI (blue). Right panel: Graph showing the % of eMyHC-positive myofibres. Data are represented as average ± SEM. n ≥ 3. Statistical significance assessed by t-test, **p < 0.01. B. Left panel: immunofluorescence staining for eMyHC (red) and laminin (green) of tibialis anterior transverse sections of young (2 months old) and old (1 year old) mdx mice treated for 15 days with vehicle (Ctrl) or TSA. Nuclei were counterstained with DAPI (blue). Right panel: graph showing the % of eMyHC-positive myofibres. Data are represented as average ± SEM. n ≥ 3. Statistical significance assessed by t-test, *p < 0.05.
Figure 3
Figure 3
Skeletal muscles from aged MDX mice are resistant to HDACi-induced beneficial effects. A. Representative images of Hematoxylin and Eosin staining of tibialis anterior transverse sections of young (1.5 months old) and old (1 year old) mdx mice treated for 45 days with vehicle (Ctrl) or TSA (0.5 mg/kg). B. Graph of the analysis of myofibre cross sectional area (CSA) of muscles represented in (A) showing that TSA increases the caliber of myofibres only in young MDX muscles. Data are represented as average ± SEM. n ≥ 3. Statistical significance assessed by t-test, *p < 0.05, **p < 0.01, ***p < 0.01. C. Representative images of Masson's trichrome staining of tibialis anterior transverse sections of young (1.5 months old) and old (1 year old) MDX mice treated for 45 days with vehicle (Ctrl) or TSA (0.5 mg/kg). D. Graph representing the fibrotic index (quantification of collagen deposition) measured as blue area (reported as pixel2) per field. Data are presented as the average ± SEM. n ≥ 3. Statistical significance assessed by t-test, *p < 0.05.
Figure 4
Figure 4
Intrinsic differentiation potential and functional interactions between MuSCs and FAPs in response to HDACi in MDX mice at different stages of disease. A. MuSCs isolated from young – 1.5 month old (upper panels) – and old – 1 year old (bottom panels) – MDX mice treated with ctrl or TSA (0.5 mg/kg) for 15 days, were isolated by FACS and cultured in vitro for 7 days in growth medium (GM) and then induced to differentiate in differentiation medium (5% HS) for further 3 days. Myogenic differentiation was assessed by MyHC immunofluorescnece. Representative images of MyHC (green) staining are shown. Nuclei were counterstained with DAPi (blue). B. Graph showing the fusion index of the experiment represented in (A). We measured the percentage of nuclei that were MyHC or MyHC+ in mononucleated myotubes (<2), the % of nuclei that were inside myotubes containing between 2 and 5 nuclei (2 << 5) and the % of nuclei inside myotubes containing more than 5 nuclei (>5). Data are represented as average ± SEM, n ≥ 2. Statistical significance tested by one-way ANOVA, *p < 0.05, **p < 0.01. C. FAPs isolated from young – 1.5 month old (upper panels) – and old – 1 year old (bottom panels) – MDX mice treated with ctrl or TSA (0.5 mg/kg) for 15 days, were isolated by FACS and cultured in vitro for 7 days in growth medium (GM) and then induced to differentiate in adipogenic differentiation medium (adp-DM) for further 6 days. Adipogenic differentiation was assessed by Oil red staining. Representative images are shown. D. Graph of the quantification of the number of Oil red O+ adipocytes per field in the same conditions showed in (C). Data are represented as average ± SEM of two different experiments (n ≥ 2); statistical significance assessed by t-test, *p < 0.05, **p < 0.01. E. Scheme: MuSCs FACS-isolated from young MDX mice were co-cultured in transwell with FAPs isolated from either young MDX mice (ctrl or TSA treated for 15 days) or old MDX mice (ctrl or TSA treated for 15 days). F. After 7 days of transwell co-culture the myogenic differentiation of satellite cells was assessed by immunostaining for MyHC (red). Nuclei were counterstained with DAPI (blue). G. Graph showing the fusion index of the experiment represented in (F). We measured the percentage of nuclei that were MyHC or MyHC+ in mononucleated myotubes (<2), the % of nuclei that were inside myotubes containing between 2 and 5 nuclei (2 << 5) and the % of nuclei inside myotubes containing more than 5 nuclei (>5). Data are represented as average ± SEM, n ≥ 2. Statistical significance tested by one-way ANOVA, *p < 0.05, **p < 0.01, ***p < 0.001.
Figure 5
Figure 5
HDACi enhance the ability of FAPs to promote myogenic activity of MuSCs on injured muscles ex vivo and in vivo. A. Schematic representation of co-culture strategy. GFP – FAPs were isolated from notexin injured (+NTX) or non-injured (ctrl) skeletal muscles of GFP mice (n = 2), treated with vehicle (ctrl) or TSA for 5 days, and then co-cultivated for 14 days with MuSCs isolated from wt mice. B. Representative images of immunostaining for MyHC (red) and GFP (green) of co-culture between FAPs from ctrl (left panel) and TSA (right panel) GFP mice and wt MuSCs. Insets show a higher magnification. C. Schematic representation of MuSCs/FAPs co-transplantation into the irradiated tibialis anterior of immunodeficient Nod/SCID mice. MuSCs were isolated from double-transgenic Luciferase-EGFP mice. FAPs were isolated from mdx mice treated with TSA or control (vehicle) for 5 days. Twenty-four hours prior to intramuscular MuSCs/FAPs co-transplantation, recipient mice received local tissue injury via intramuscular NTX injection in the tibialis anterior. D. Non-invasive bioluminescence imaging was used to monitor the effect of FAPs on MuSC proliferation in vivo. 1000 Luc/GFP MuSC were co-transplanted with 1000 FAPs from mdx mice previously treated with TSA or control. Images were taken up to 15 days post-transplantation and luminescence quantified. E. Plots of bioluminescence data from (D) represented in photons/s/cm2 as an average ± SEM and individually (n = 4, *p < 0.05).
Figure 6
Figure 6
FAPs from HDACi-treated mice enhance the in vivo differentiation potential of MuSCs and restore the responsiveness of aged MDX muscles to HDACi beneficial effects. A. Schematic representation of transplant strategy. Skeletal muscles of GFP mice were injured by notexin (NTX) injection. Injured GFP mice were treated with TSA or vehicle (ctr). After 5 days of treatment FAPs and MuSCs were isolated by FACS and 30,000 GFPpos cells of each population were transplanted into the tibialis anterior (pre-injured with NTX 1 day before) of recipient 1-year-old MDX mice, either alone or in co-tranplantation (FAPs + MuSCs). Three weeks after, transplanted muscles were isolated and processed for staining with antibodies against GFP (green) and laminin (red). Nuclei were counterstained with DAPI (blue). B. Left panels: representative images of engrafted areas in muscles transplanted with ctrl and TSA MuSCs. Right panel: quantification of the total number of GFP+ myofibres per muscle. Data are represented as average ± SEM. n = 3. C. Representative images of engrafted areas in muscles transplanted with ctrl MuSCs alone (left panel) or co-transplanted with FAPs ctrl (mid panel) and FAPs TSA (right panel). Quantification of the total number of GFP+ myofibres per muscle shows that co-transplantation with FAPs-ctrl significantly increases the number of GFP+ myofibres. This number is further increased when MuSCs are co-transplanted with FAPs isolated from TSA treated mice. Data are represented as average ± SEM. n = 3. Statistical significance tested by one-way ANOVA, **p < 0.01. ***p < 0.001. D. Schematic representation of transplant strategy. 30,000 FACS-isolated FAPs from skeletal muscles of 2-month old wt mice were transplanted into the right tibialis anterior (pre-injured with NTX 1 day before) of recipient 1-year-old MDX mice, while the controlateral was left untransplanted. Recipient mice were then treated with vehicle (Ctrl) or TSA for 45 days. Transplanted and non-transplanted muscles were harvested and immunostained with antibody against laminin (red) and nuclei counterstained with DAPI (blue). E. Representative images of muscles untransplanted (ctrl, upper panels) and transplanted with FAPs (+FAPs, bottom panels), either ctrl (left panels) and TSA (right panels) treated as described in (D). F. Graph of the analysis of myofibre cross sectional area (CSA) of muscles represented in (E). Upper graph represents the CSA of untransplanted muscles (Mdx Ctrl); bottom graph shows CSA of transplanted muscles (+FAPs). Data are represented as average ± SEM. n = 2. Statistical significance assessed by t-test, *p < 0.05. **p < 0.01.
Figure 7
Figure 7
Follistatin is soluble mediator of functional interactions between FAPs and MuSCs from mdx mice exposed to HDACi. A. FAPs and MuSCs were isolated from 1.5-month old mdx mice ctrl- and TSA-treated for 15 days. Cells were cultured for 7 days in growth medium (GM) and then Follistatin RNA levels were analysed by qRT-PCR. Follistatin is preferentially expressed by FAPs, as compared to MuSCs, and is strikingly up-regulated in FAPs isolated from TSA-treated mdx muscles. B. MuSCs from mdx mice and FAPs, from either mdx ctrl or TSA treated (15 days) mice, were co-cultured in transwell chambers (pore of 1 µm). FAPs were plated on the transwell insert and MuSCs were plated on the bottom compartment. After 7 days of co-cultures in the presence or absence of neutralizing antibodies against Follistatin, MuSCs were immunostained for MyHC (red) and nuclei counterstained by DAPI (blue). C. Graph showing the fusion index of the experiment represented in (B). We measured the percentage of nuclei that were MyHC or MyHC+ in mononucleated myotubes (<2), the % of nuclei that were inside myotubes containing between 2 and 5 nuclei (2 << 5) and the % of nuclei inside myotubes containing more than 5 nuclei (>5). Data are represented as average ± SEM, n ≥ 2. Statistical significance tested by one-way ANOVA, **p < 0.01, ***p < 0.001. D. Follistatin RNAi in FAPs from ctrl mdx mice was performed by transfection of a shRNAi against follistatin (shFollistatin) and pSuper was used as ctrl. Graph shows the RNA levels of follistatin measured by qRT-PCR in FAPs upon RNAi. E. FAPs were treated (24 h) with TSA or not (ctrl) in vitro and subsequently co-cultured for 5 days in transwell, as described in B, with MuSCs isolated from mdx mice. MuSCs were then immunostained for MyHC (red) and nuclei counterstained by DAPI (blue). F. Graph showing the fusion index of the experiment represented in (E). We measured the percentage of nuclei that were MyHC or MyHC+ in mononucleated myotubes (<2), the % of nuclei that were inside myotubes containing between 2 and 5 nuclei (2<<5) and the % of nuclei inside myotubes containing more than 5 nuclei (>5). Data are represented as average ± SEM, n ≥ 2. Statistical significance tested by one-way ANOVA, *p < 0.05, **p < 0.01.

References

    1. Blau HM, Webster C, Pavlath GK. Defective myoblasts identified in Duchenne muscular dystrophy. Proc Natl Acad Sci USA. 1983;80:4856–4860. - PMC - PubMed
    1. Brack AS, Rando TA. Intrinsic changes and extrinsic influences of myogenic stem cell function during aging. Stem Cell Rev. 2007;3:226–237. - PubMed
    1. Colussi C, Mozzetta C, Gurtner A, Illi B, Straino S, Ragone G, Pescatori M, Zaccagnini G, Rosati G, Minetti G, et al. HDAC2 blockade by nitric oxide and histone deacetylase inhibitors reveals a common target in Duchenne muscular dystrophy treatment. Proc Natl Acad Sci. 2008;105:19183–19187. - PMC - PubMed
    1. Consalvi S, Saccone V, Giordani L, Minetti G, Mozzetta C, Puri PL. Histone deacetylase inhibitors in the treatment of muscular dystrophies: epigenetic drugs for genetic diseases. Mol Med. 2011;17:457–465. - PMC - PubMed
    1. Dalkilic I, Kunkel LM. Muscular dystrophies: genes to pathogenesis. Curr Opin Genet Dev. 2003;13:231–238. - PubMed

Publication types

MeSH terms

Substances