. 2013 Dec;31(12):2667-79.
doi: 10.1002/stem.1371.

Gene regulatory networks mediating canonical Wnt signal-directed control of pluripotency and differentiation in embryo stem cells

Affiliations

Gene regulatory networks mediating canonical Wnt signal-directed control of pluripotency and differentiation in embryo stem cells

Xiaoxiao Zhang et al. Stem Cells. 2013 Dec.

Abstract

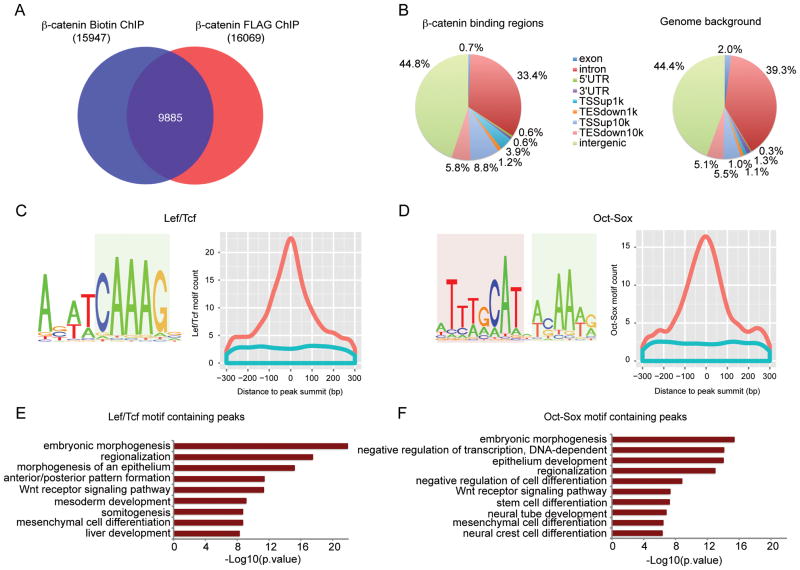
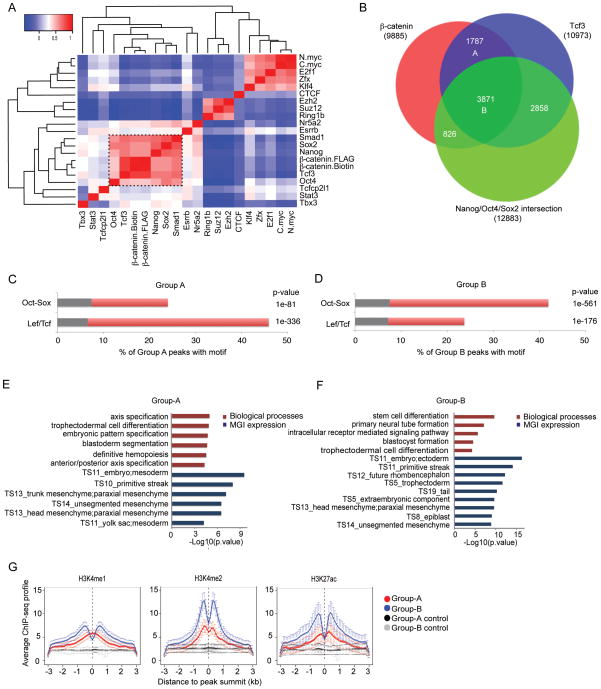
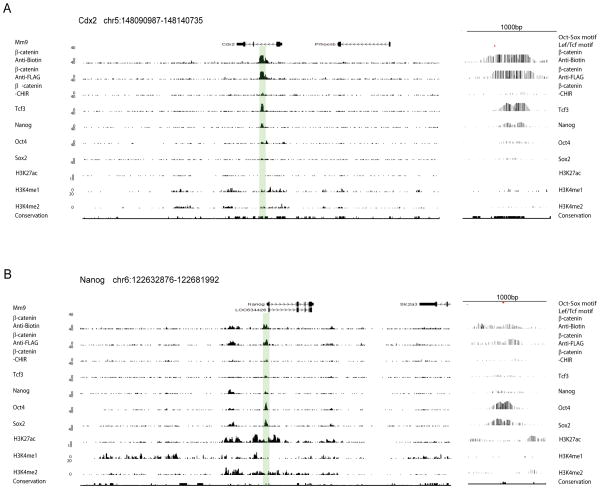
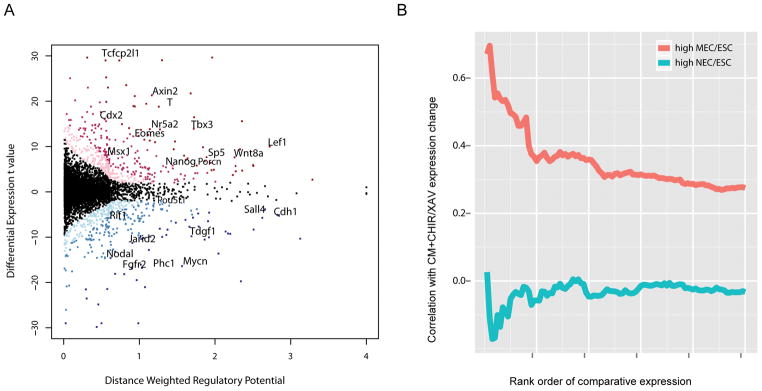
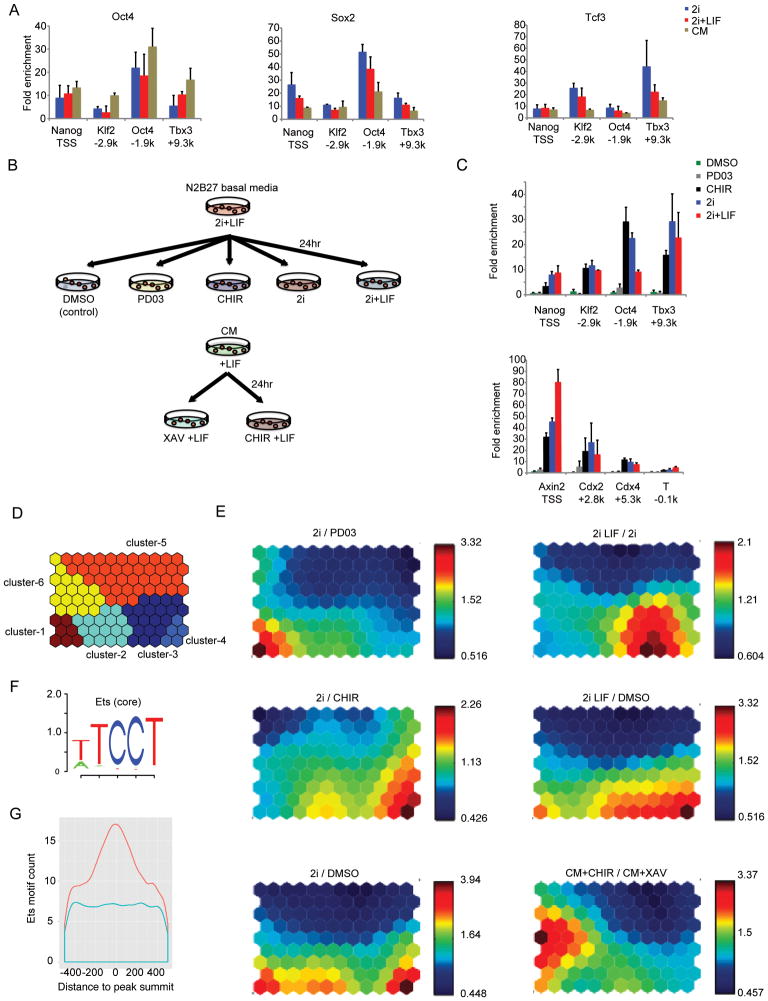
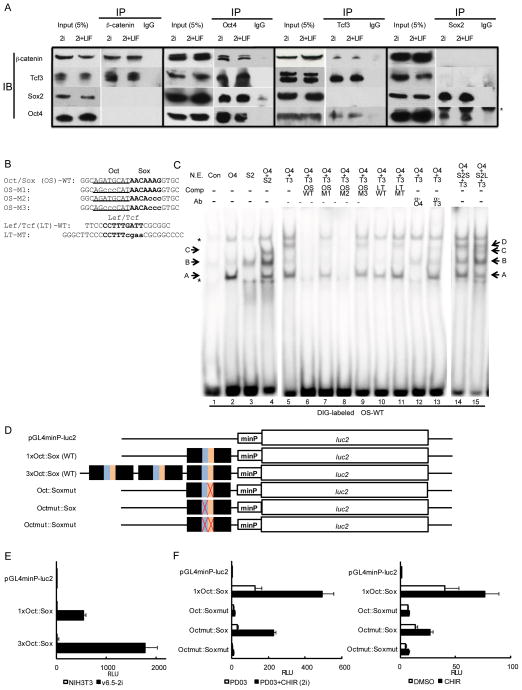
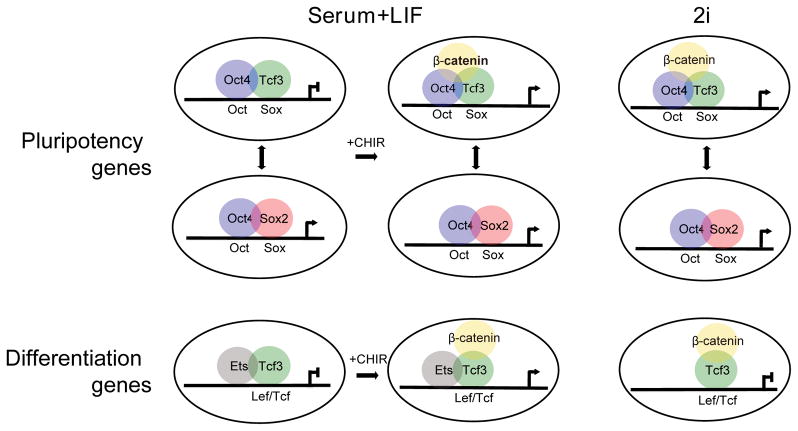
Canonical Wnt signaling supports the pluripotency of embryonic stem cells (ESCs) but also promotes differentiation of early mammalian cell lineages. To explain these paradoxical observations, we explored the gene regulatory networks at play. Canonical Wnt signaling is intertwined with the pluripotency network comprising Nanog, Oct4, and Sox2 in mouse ESCs. In defined media supporting the derivation and propagation of ESCs, Tcf3 and β-catenin interact with Oct4; Tcf3 binds to Sox motif within Oct-Sox composite motifs that are also bound by Oct4-Sox2 complexes. Furthermore, canonical Wnt signaling upregulates the activity of the Pou5f1 distal enhancer via the Sox motif in ESCs. When viewed in the context of published studies on Tcf3 and β-catenin mutants, our findings suggest Tcf3 counters pluripotency by competition with Sox2 at these sites, and Tcf3 inhibition is blocked by β-catenin entry into this complex. Wnt pathway stimulation also triggers β-catenin association at regulatory elements with classic Lef/Tcf motifs associated with differentiation programs. The failure to activate these targets in the presence of a mitogen-activated protein kinase kinase (MEK)/extracellular signal-regulated kinase (ERK) inhibitor essential for ESC culture suggests MEK/ERK signaling and canonical Wnt signaling combine to promote ESC differentiation.

Keywords: Differentiation; Mouse embryonic stem cells; Pluripotency; Wnt; β-catenin.


Conflict of interest statement

Disclosure of potential conflicts of interest

The authors indicate no potential conflicts of interest.

Figures

Figure 1
Figure 1. Genome-wide mapping of β-catenin binding regions in mESCs cultured in CM
(A) Venn diagram showing the overlap between β-catenin Biotin ChIP-seq and FLAG ChIP-seq peaks. (B) Genome-wide distribution of β-catenin binding regions relative to mouse genes compared with random control region genomic distribution. Binding regions were annotated as exon, introns, 5′ un-translated region (5′ UTR), 3′ UTR, within 0–1 kb upstream of TSS (TSSup1k), within 1–10 kb upstream of TSS (TSSup10k), within 0–1 kb downstream of TES (TESdown1k), within 1–10kb downstream of TES (TESdown10k), or > 10kb away from the nearest genes (intergenic). (C) (D) Top enriched motifs recovered from de novo motif analysis of β-catenin binding regions. Left panels show motif logos. HMG box motif is highlighted in light blue, and POU family motif in light red. Right panels show histogram of motifs ± 300bp around peak summit of β-catenin (orange) or matched control peak (blue). (E) (F) GO terms enriched for β-catenin peaks containing Lef/Tcf motif (E) or Oct-Sox motif (F) using GREAT. The –log10 of the raw binomial p-value is reported.
Figure 2
Figure 2. Characterization of β-catenin and ESC pluripotency factors binding
(A) Heat map depicting the correlation of β-catenin and ESC factors bindings. Red: positive correlation; blue: negative correlation. (B) Venn diagram of β-catenin, Tcf3, and intersection of Nanog/Oct4/Sox2 peak regions. Two groups of peaks are highlighted: Group-A: β-catenin::Tcf3, and Group-B: β-catenin::Tcf3::NOS. (C) (D) Enriched motifs in Group-A and Group-B. Red: motif occurrence in β-catenin peaks; grey: motif occurrence in matched control regions with the same coverage. P-value was calculated according to two proportion z-test. (E) (F) Functional annotation of Group-A and Group-B regions using GREAT. The –log10 of the raw binomial p-value is shown. (G) Aggregation plots of H3K4me1, H3K4me2, and H3K27ac signals ±3 kb around the peak summit for binding regions in Group-A (red) and Group-B (blue) as well as corresponding matched control regions with standard error bars (black and grey). The analysis is done using HOMER . Bin size 100 bp.
Figure 3
Figure 3. CisGenome browser screenshots showing combinatorial binding pattern of β-catenin and core pluripotency factors in CM
β-catenin binding to known Wnt target genes related to differentiation (Cdx2, A), and pluripotency (Nanog, B). Endogenous association of β-catenin is also displayed in the absence of CHIR stimulation (CHIR-). Tcf3, Nanog, Oct4, Sox2 and histone modification profiles displayed here are from published datasets (see Results). A zoom in on highlighted regions with motif annotation is displayed to the right side.
Figure 4
Figure 4. Integration of β-catenin ChIP-seq and expression profiling in mESCs treated with an activator or inhibitor of canonical Wnt signaling
(A) Scatter plot of β-catenin direct target gene prediction based on distance weighted regulatory potential score from ChIP-seq and t-value of differential CHIR/XAV expression in CM. Red dots: up-regulated genes with FDR < 0.10; blue dots: down-regulated genes with FDR < 0.10. The darker red/blue represents the higher likelihood for a gene being β-catenin direct target. The horizontal and vertical histograms reflect the distribution of the index for distance weighted regulatory potential and differential expression t value, respectively. Representative genes are labeled. (B) Correlation of top 1000 genes of high MEC/ESC or NEC/ESC expression ratio (from microarray data in Shen et al.) (x-axis) with their differential expression fold changes in CM+CHIR/CM+XAV (y-axis). Genes were ranked by their expression ratio in MEC versus ESC or NEC versus ESC from high to low. For the top 1000 genes in the two ranks, their expression ratio in CM+CHIR versus CM+XAV were checked. Bins represent the top 20 genes, then the top 40 genes, etc., as determined by the MEC/ESC ratio or NEC/ESC ratio. The correlation of MEC/ESC or NEC/ESC ratio with CM+CHIR/CM+XAV ratio for each bin were calculated and plotted.
Figure 5
Figure 5. Roles of small molecules CHIR and PD03 in 2i
(A) ChIP-qPCR for Oct4, Sox2 and Tcf3 interaction at defined regulatory regions surrounding pluripotency target genes in mESCs cultured in 2i, 2i+LIF, and CM. Data represent the mean of biological replicates. (B) Experimental scheme for studying the role of CHIR and PD03 in CM and 2i-adapted mESCs. ChIP-qPCR and microarray analysis were performed in 2i-adapted mESCs cultured for 24 hours with DMSO (control), PD03, CHIR, 2i, and 2i+LIF. Cells at passage 20 under the 2i+LIF condition were subjected to each assay. Cells that had been maintained in CM on feeder cells were cultured for 24 hours in CM with CHIR or XAV prior to microarray analysis. (C) ChIP-qPCR for β-catenin at selected loci near pluripotency-related genes (upper), differentiation-related and Wnt target genes (lower) on 2i-adapted mESCs. ChIP using anti-FLAG antibodies was performed according to the experimental scheme described in (B). Data show the mean and standard error of the mean (s.e.m.) for three biological replicates. (D) K-means clustering was used to classify genes with expression fold change > 2 in at least one comparison group of 2i/PD03, 2i/CHIR, 2i/DMSO, 2iLIF/2i, 2iLIF/DMSO, and CM+CHIR/CM+XAV. A total of 388 genes were clustered into six clusters. (E) Individual component maps are shown for each pair-wise comparison. Top left: 2i/PD03; middle left: 2i/CHIR; bottom left: 2i/DMSO; top right: 2iLIF/2i; middle right: 2iLIF/DMSO; bottom right: CM+CHIR/CM+XAV. In general, red indicates up-regulation and blue down-regulation. The number by each color bar is the actual number of fold change. (F) Five bp core Ets motif logo TCCTW from TRANSFAC motif M00339. (G) Enrichment of Ets core motif ± 500bp around β-catenin peak summit (orange) compared with matched control regions (blue).
Figure 6
Figure 6. Physical association of β-catenin, Oct4, Sox2, and Tcf3 and in vitro binding properties of Oct4, Sox2, and Tcf3 to the Oct-Sox composite motif
(A) Co-immunoprecipitation analysis of β-catenin, Tcf3, Oct4, and Sox2 complexes in mESCs. IP, immunoprecipitation; IB, immunoblotting. Asterisk indicates heavy chains of antibody used in IP. (B) Sequence of oligonucleotide probes used in EMSA. Oct motif is underlined; Sox and Lef/Tcf motifs are bolded. Mutations are shown in lowercases. (C) Cooperative bindings of Oct4, Sox2, and Tcf3 to the Oct-Sox (OS) composite motif, determined by EMSA. The indicated combinations of nuclear extracts isolated from 293T cells overexpressing Pou5f1 (Oct4), Sox2, or Tcf7l1 (Tcf3) were analyzed by EMSA using DIG-labeled OS probes. Bands A, B, C, and D denoted with arrows indicate Oct4-binary, Sox2-binary, Oct4-Sox2-ternary, and Oct4-Tcf3-ternary complexes with the Oct/Sox probe, respectively. Asterisks indicate non-specific bands. NE, nuclear extracts; Con, extracts from mock-transfected cells; O4, extracts from Oct4-overexpressing cells; S2, extracts from Sox2-overexpressing cells; S2S, smaller amount of extracts (0.2 μg) from Sox2-overexpressing cells; S2L, larger amount of extracts (2 μg) from Sox2-overexpressing cells. T3, extracts from Tcf3-overexpressing cells; Comp, unlabeled competitors; Ab, antibodies; α-O4, anti-Oct4 antibody; α-T3, anti-Tcf3 antibody. Data here is extracted from Figure S7B which provides more extensive competitor experiments and antibody supershift experiments to identity each shifted band. (D) Schematic of luciferase reporter constructs used in (E) and (F). Pou5f1 distal enhancer region containing the Oct-Sox composite motif drives the luciferase gene with a minimal TATA-box promoter element under pGL4 vector backbone. Each mutation corresponds to mutant motifs in EMSA analysis. (E) Luciferase reporter assay using Pou5f1 distal enhancer region in NIH3T3 cells and 2i-cultured mESCs (v6.5). Forty-eight hours after transfection with reporter constructs, cells were subjected to the assay. mESCs were maintained under 2i+LIF condition for 11 passages prior to the assay. (F) Luciferase reporter assay in mESCs (v6.5) cultured under 2i condition (left) or CM (right). mESCs were maintained under 2i+LIF condition for 11 passages prior to the assay. Upon transfection with reporter constructs, cells were switched into basal media of 2i culture (mixture of neurobasal media, DMEM/F12, N2, and B27 supplements) with PD03 or 2i (left), or CM in the presence or absence of CHIR (right). The assay was performed 48 hours after transfection. RLU, relative light unit.
Figure 7
Figure 7. Schematic model of β-catenin-dependent regulation of pluripotency network
Oct4-Sox2 binding to Oct-Sox composite motifs maintains activity of key regulators of pluripotency. Tcf3 interaction with Oct factors at the same motif is predicted to destabilize this circuit. CHIR-mediated stabilization of β-catenin has opposing actions. Entry of β-catenin into Oct4/Tcf3 complexes abrogates Tcf3 actions thereby promoting pluripotency. However, the production of active canonical Wnt transcriptional complexes engages differentiation targets destabilizing pluripotency. PD03-mediated inhibition of MEK/ERK signaling restores a pluripotency balance blocking the activation of Wnt dependent differentiation genes enabling culture under 2i conditions. Given the role of MEK/ERK signaling downstream of receptor tyrosine kinases in the regulation of the Ets-family of transcriptional regulators, and the enrichment of Ets motifs in predicted cis-regulatory, we propose the combined action of Wnt and RTK signaling in the differentiation of ES cells.

References

    1. Brook FA, Gardner RL. The origin and efficient derivation of embryonic stem cells in the3mouse. Proceedings of the National Academy of Sciences. 1997;94:5709–5712. - PMC - PubMed
    1. Kim J. An Extended Transcriptional Network for Pluripotency of Embryonic Stem Cells. Cell. 2008;132:1049–1061. - PMC - PubMed
    1. Loh Y-H, Wu Q, Chew J-L, et al. The Oct4 and Nanog transcription network regulates pluripotency in mouse embryonic stem cells. Nat Genet. 2006;38:431–440. - PubMed
    1. Jiang J, Chan Y-S, Loh Y-H, et al. A core Klf circuitry regulates self-renewal of embryonic stem cells. Nat Cell Biol. 2008;10:353–360. - PubMed
    1. Gonzalez F, Boue S, Belmonte JCI. Methods for making induced pluripotent stem cells: reprogramming a la carte. Nature Reviews Genetics. 2011;12:231–242. - PubMed

Publication types