. 2013;9(3):e1002942.
doi: 10.1371/journal.pcbi.1002942. Epub 2013 Mar 7.

Noise-invariant neurons in the avian auditory cortex: hearing the song in noise

Affiliations

Noise-invariant neurons in the avian auditory cortex: hearing the song in noise

R Channing Moore et al. PLoS Comput Biol. 2013.

Abstract

Given the extraordinary ability of humans and animals to recognize communication signals over a background of noise, describing noise invariant neural responses is critical not only to pinpoint the brain regions that are mediating our robust perceptions but also to understand the neural computations that are performing these tasks and the underlying circuitry. Although invariant neural responses, such as rotation-invariant face cells, are well described in the visual system, high-level auditory neurons that can represent the same behaviorally relevant signal in a range of listening conditions have yet to be discovered. Here we found neurons in a secondary area of the avian auditory cortex that exhibit noise-invariant responses in the sense that they responded with similar spike patterns to song stimuli presented in silence and over a background of naturalistic noise. By characterizing the neurons' tuning in terms of their responses to modulations in the temporal and spectral envelope of the sound, we then show that noise invariance is partly achieved by selectively responding to long sounds with sharp spectral structure. Finally, to demonstrate that such computations could explain noise invariance, we designed a biologically inspired noise-filtering algorithm that can be used to separate song or speech from noise. This novel noise-filtering method performs as well as other state-of-the-art de-noising algorithms and could be used in clinical or consumer oriented applications. Our biologically inspired model also shows how high-level noise-invariant responses could be created from neural responses typically found in primary auditory cortex.


Conflict of interest statement

The authors have declared that no competing interests exist.

Figures

Figure 1
Figure 1. Noise-invariant responses in the avian NCM.
Responses of two neurons (Cell A and Cell B) to song presented alone and over noise. The top row shows the spectrogram of the same zebra finch song used in the two recordings. Song starts at 0s. Below the spectrogram are raster plots and corresponding smoothed PSTHs. The first raster and PSTH correspond to the response of each neuron to the song alone presented at 70 dB SPL. Clear temporal synchrony across the four trials can be seen illustrative of an equally robust response to song stimuli. The second raster and PSTH correspond to the responses to song+ modulation limited noise (ml-noise) presented at 3dB signal to noise ratio. Ml-noise is synthesized by low-pass filtering white noise in the space of temporal and spectral modulations (see methods). The pink highlights show the duration of the stimulus (song + noise). The onset and offset of the stimulus is different in each trial because the trials are aligned to the onset of the song and the noise masker began and ended with a different delay in each trial. The noise was also different in each trial. This addition of naturalistic noise destroys the cross-trial synchrony in the response for the neuron shown in the left column but not for the neuron shown in the right column.
Figure 2
Figure 2. Location of noise invariant neurons in NCM.
A. Photomicrograph of Nissl-stained brain slice in one bird showing the typical trajectory of the electrode penetration. By carefully orienting our electrode angle, we were able to sample NCM along its entire dorsal to ventral extent. B. Scatter plot of noise invariance against stereotactic depth of neural recordings. Noise invariance and recording depth were significantly correlated (slope = 0.15/mm, adjusted R2 = 0.13, p = 0.02). The example neurons are labeled A and B on the scatter plot. C. Scatter plot showing the relationship between the best frequency (Y-axis) and the depth of the recording along the dorsal to ventral axis of NCM (X-axis). The solid line is the linear regression between these two variables (adjusted R2 = 0.34, p<10-3).
Figure 3
Figure 3. Spectral-temporal tuning and invariance.
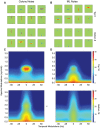
Vertical axis in A–C shows the noise invariance in the neural response. Each neuron (each point on the scatterplots) is represented by its STRF (0.25–8 kHz on the vertical axis, 0–60 ms on the horizontal). A. Invariance vs STRF Model Invariance. The solid line has slope 1.0, showing equal performance between the STRF model and the neural response. Neurons with significantly different performance (p<0.05, two-tailed t-test) have their receptive fields outlined. Dashed line shows regression fit (slope = 0.40, Adjusted R2 = 0.12, p = 0.034), indicating the positive correlation between the invariance predicted by the STRF and actual invariance. B. Invariance vs Spectral Modulation Tuning. Neurons sensitive to higher spectral modulations are more invariant (Adjusted R2 = 0.192, p = 0.007). C. Invariance vs Temporal Modulation Tuning. Neurons sensitive to lower temporal modulations are more invariant (Adjusted R2 = 0.15, p = 0.015). D. Ensemble modulation transfer functions for neurons grouped by invariance. Low invariance neurons (left panel, invariance<0.3, n = 11) respond to high temporal and low spectral frequency modulations. Neurons with moderate invariance (middle panel, 0.3<invariance<0.4, n = 11) transmit faster, sharper modulations. Neurons with high invariance (right panel, invariance>0.2, n = 10) respond mostly to slower and spectrally sharp sounds.
Figure 4
Figure 4. Range of invariance observed across neurons and song stimuli.
Two dimensional heat plot that shows the value of the variance metric obtained for each neuron (n = 32) and each song stimuli (n = 36). The neurons are sorted from low mean invariance (bottom row) to high mean invariance (top row). The columns on the left show the standard deviation of the variance and the coefficient of variation for each neuron. The color bar is placed at the bottom of the graph and is the same for the variance, the standard deviation and the coefficient of variation. The grey cells in the matrix correspond to (neuron, stimulus) where we were not able to calculate the invariance either because of missing data or very low response rates.
Figure 5
Figure 5. Noise reduction algorithm.
We implemented a biologically inspired noise-filtering algorithm using an analysis/synthesis paradigm (top row) where the synthesis step is based on a STRF filter bank decomposition. The bottom row shows the model neural responses obtained from a sound (spectrogram of noise-corrupted song) using the filter bank of biologically realistic STRFs. These responses are then weighed optimally with weights d1,..,dM to select the combination of responses that are most noise-invariant. The weighted responses are then transformed into frequency space by multiplying the weighted responses by the frequency marginal of the corresponding STRF (color-matched on the figure) to obtain gains as a function of frequency. The top row illustrates how these time-varying frequency gains can then be applied to a decomposition of the sound into frequency channels allowing for the synthesis step and an estimate of the clean signal. This technology is available for licensing via UC Berkeley's Office of Technology Licensing (Technology: Modulation-Domain Speech Filtering For Noise Reduction; Tech ID: 22197; Lead Case: 2012-034-0).
Figure 6
Figure 6. Performance of STRF based noise-reduction.
A. Performance of three noise reduction algorithms (STRF, OWF, SINR) and lower and upper bounds (Stim, IBM) on song embedded in colony noise or modulation-limited (ML) noise. The performance ratio (y-axis) depicts the improvement in noise levels over the noise-corrupted signal, as measured by the cross-correlation in the log spectrogram domain, with the error bars representing one standard deviation across five noisy stimuli. On the x-axis are the models we have tested, where “Stim” is the noise-corrupted signal, “STRF” is the model presented here, “OWF” is the optimal Wiener filter, “SINR” is a spectral subtraction algorithm similar to STRF but based on engineering constructs, and “IBM” is an ideal binary mask. B. Spectrograms of the signal masked with noise from the zebra finch colony, the clean zebra finch song, and our signal reconstruction, followed by the time-frequency gains. C. Same as B but for modulation-limited noise. Sounds can be found in the SI.
Figure 7
Figure 7. Model STRFs for noise reduction.
A. The eight most positively (top) and most negatively (bottom) weighted STRFs from the noise reduction algorithm trained with a background of colony noise. B, Same as in A, but for the model trained with a background of modulation-limited noise. C. The ensemble modulation transfer functions for the top 16 and bottom 16 STRFs for the model trained in colony noise, sorted as in A. D Same as in C, but for the model trained in modulation-limited noise.

References

    1. Freiwald WA, Tsao DY (2010) Functional Compartmentalization and Viewpoint Generalization Within the Macaque Face-Processing System. Science 330: 845–851. - PMC - PubMed
    1. Rauschecker JP, Tian B, Hauser M (1995) Processing of complex sounds in the macaque nonprimary auditory cortex. Science 268: 111–114. - PubMed
    1. Sadagopan S, Wang X (2008) Level invariant representation of sounds by populations of neurons in primary auditory cortex. Journal of Neuroscience 28: 3415–3426. - PMC - PubMed
    1. Billimoria CP, Kraus BJ, Narayan R, Maddox RK, Sen K (2008) Invariance and sensitivity to intensity in neural discrimination of natural sounds. Journal of Neuroscience 28: 6304–6308. - PMC - PubMed
    1. Bendor D, Wang X (2005) The neuronal representation of pitch in primate auditory cortex. Nature 436: 1161–1165. - PMC - PubMed

Publication types