. 2013;9(3):e1002955.
doi: 10.1371/journal.pcbi.1002955. Epub 2013 Mar 7.

Dissection of regulatory networks that are altered in disease via differential co-expression

Affiliations

Dissection of regulatory networks that are altered in disease via differential co-expression

David Amar et al. PLoS Comput Biol. 2013.

Abstract

Comparing the gene-expression profiles of sick and healthy individuals can help in understanding disease. Such differential expression analysis is a well-established way to find gene sets whose expression is altered in the disease. Recent approaches to gene-expression analysis go a step further and seek differential co-expression patterns, wherein the level of co-expression of a set of genes differs markedly between disease and control samples. Such patterns can arise from a disease-related change in the regulatory mechanism governing that set of genes, and pinpoint dysfunctional regulatory networks. Here we present DICER, a new method for detecting differentially co-expressed gene sets using a novel probabilistic score for differential correlation. DICER goes beyond standard differential co-expression and detects pairs of modules showing differential co-expression. The expression profiles of genes within each module of the pair are correlated across all samples. The correlation between the two modules, however, differs markedly between the disease and normal samples. We show that DICER outperforms the state of the art in terms of significance and interpretability of the detected gene sets. Moreover, the gene sets discovered by DICER manifest regulation by disease-specific microRNA families. In a case study on Alzheimer's disease, DICER dissected biological processes and protein complexes into functional subunits that are differentially co-expressed, thereby revealing inner structures in disease regulatory networks.


Conflict of interest statement

The authors have declared that no competing interests exist.

Figures

Figure 1
Figure 1. Overview of the class specific differential correlation (DC) analysis.
The input (left) is a set of expression profiles from different classes of samples. In one analysis (top center), T-scores are computed for the class of interest and are normalized using the T-scores calculated on random data sets, created by shuffling the sample labels. The normalized scores are then used to find gene clusters that manifest DC in the tested class compared to all other classes (top right, up/down-correlated modules; blue edges indicate class-specific DC). A second similarity analysis (bottom center) is performed to detect gene pairs that are co-expressed in all classes. In each class, an EM algorithm is used to divide the correlations to high (‘denoted “mates,” red distribution) and low (denoted “non-mates,” green distribution), and consistent similarities are defined as cases in which gene pairs are mates in all classes. The two scores are used to find pairs of gene modules in which each module is a group of consistently correlated genes (red edges), whereas the correlation between the modules is differential (blue edges). These module pairs are denoted as meta-modules (center right). As a by-product, individual modules are recorded (bottom right).
Figure 2
Figure 2. T-score distributions in real and permuted data sets.
(A) The distributions of the T-scores in the real (blue) and permuted (red) data sets. The variance of the distributions is larger for the T-scores on the real data, even though the means are similar. Since in the IBD and SLE data sets most T-scores are close to zero, we also show the upper tails of their distributions. (B) The standard deviation of the T-scores in the real and permuted data sets. The standard deviation is larger in all real data sets, indicating that high T-scores (in absolute value) are more probable in the real data sets. Permuted data sets were generated by shuffling sample labels. Results are the average of 50 permutations.
Figure 3
Figure 3. Examples of differential correlation patterns.
(A) An up-correlated 242-gene cluster discovered in the AD data set. The correlation matrices of the cluster genes in the AD and control classes are shown. The average correlation is 0.72 and 0.44 in the AD and the control classes, respectively. (B) A down-correlated meta-module discovered in the lung cancer data. It contains two gene modules of sizes 39 and 77. The correlation matrices of the meta-module genes are shown for the lung cancer and the control classes. The correlation between the two modules is −0.43 in the control class, whereas the correlation in the lung cancer class drops to −0.86. Each module is a group of genes that are highly correlated in both classes: the average correlation within each module is >0.75. (C) The correlation between genes RAD23B and ALPK1 in the lung cancer data. The two genes are marked by arrows in B. Each dot corresponds to an individual and the axes mark the base-2 logarithm of expression values of the two genes in that individual. The genes are negatively correlated in the lung cancer class (r = −0.76) but are uncorrelated in the controls (r = −0.12). See Text S2 for additional examples using simulated data.
Figure 4
Figure 4. Comparison of absolute difference in correlations in gene sets found by different algorithms.
(A) The extent of DC compared to random gene sets. For each discovered module and module pair we created 200 random gene sets of the same size and calculated their absolute DC. We then calculated the ratio between the scores of the discovered modules and the mean of the random gene sets. The green bars show the mean of the top two DiffCoEx modules in each data set. For testing DiffCoEx and CLICK module pairs (purple and blue bars respectively), we took into account only module pairs with fold change greater than 1.1. CoXpress found no significant clusters of formula image
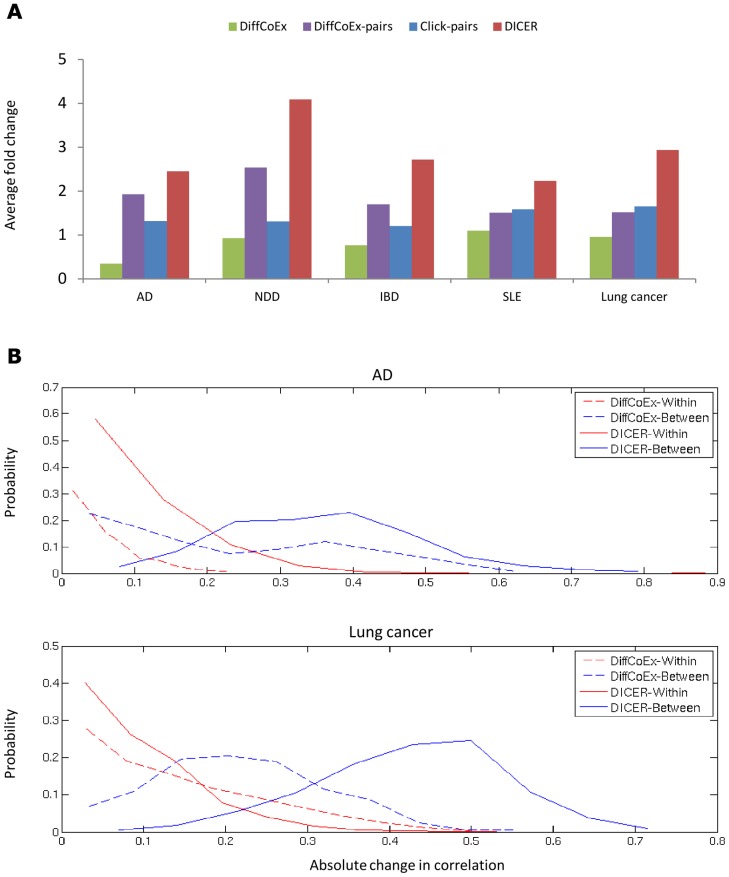
15 genes. For DICER (red bars), the top ten up-correlated and the top ten down-correlated module pairs were taken into account. (B) The distribution of within- and between-module absolute change in correlation for DICER and DiffCoEx in the AD and lung cancer data sets.
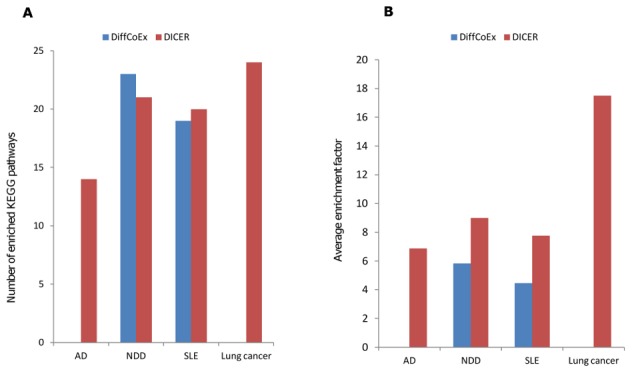
Figure 5
Figure 5. KEGG pathway enrichment analysis.
The modules found by DiffCoEx and DICER were tested for KEGG pathway enrichment using the hypergeometric test with 0.05 FDR correction. Neither method reported significant enrichment on the IBD data set. (A) The number of enriched pathways. (B) Average enrichment factors of the enriched sets. The enrichment factor is the ratio between the fraction of the pathway genes in the tested set and the fraction of the pathway genes in the data set.
Figure 6
Figure 6. DC map of modules enriched with KEGG pathways discovered in the Alzheimer's disease data.
(A) DC map of modules enriched with KEGG pathways. Nodes represent gene modules and edges correspond to DC (blue for increased correlation in AD, red for decreased correlation). Node size is proportional to the size of the module. The enriched pathways are noted on the module. NDD pathways refer to Parkinson's disease (PD), Huntington's disease, Alzheimer's disease and oxidative phosphorylation. CAMs refer to the cell adhesion molecules pathway. (B) Analysis of DC between the PD and the NDD modules (the circled sub-graph in A). Left: the known interactions involving the genes of the two modules according to GENEMANIA. Most known interactions are between the modules. Right: co-expression networks of the same genes for AD patients and controls. Rectangular nodes are genes related to oxidoreductase activity, hexagons indicate genes related to phosphate metabolic process. An edge between two genes indicates correlation >0.3 in the tested class. The average correlation between the modules was 0.3 in the controls and 0 in the AD class. Node colors indicate the DE between case and control, measured by the base-10 logarithm of the p-value (t-test) of the tested gene. The genes circled in the NDD pathway module are also part of the PD pathway. These genes are also down-correlated in AD, whereas all other genes show only mild DE.
Figure 7
Figure 7. Ribosomal sub-complexes discovered in the Alzheimer's disease (AD) data.
(A) A DC map of modules enriched with protein complexes. Node size is proportional to the size of the module. The enriched pathway names are noted on the module. 40S: 40S cytoplasmatic Ribosome complex, 60S: 60S cytoplasmatic Ribosome complex, Nop56: Nop56p-associated pre-rRNA complex. Blue and red edges mark increased and decreased correlation in AD, respectively. (B) Analysis of DC in the Ribosome and 60S-Nop56 meta-module circled in A. Left: the known interactions involving the genes of the two modules according to GENEMANIA. Right: co-expression networks of the same genes for AD patients and controls. An edge between two genes indicates correlation >0.5 in the tested class. The average correlation between modules was 0.4 and 0.75 in the controls and AD class, respectively. Node colors show DE between AD and control, measured as the base-10 logarithm of the p-value (t-test) of the tested gene. Circled subgroups: proteins belonging to 40S cytoplasmatic Ribosome and Nop56 complex. 40S complex genes are up-regulated in AD, whereas 60S genes show only mild DE.

References

    1. Schulze A, Downward J (2001) Navigating gene expression using microarrays - a technology review. Nature Cell Biology 3: E190–E195. - PubMed
    1. Barrett T, Troup DB, Wilhite SE, Ledoux P, Rudnev D, et al. (2007) NCBI GEO: mining tens of millions of expression profiles - database and tools update. Nucleic Acids Research 35: D760–D765. - PMC - PubMed
    1. Parkinson H, Kapushesky M, Shojatalab M, Abeygunawardena N, Coulson R, et al. (2007) ArrayExpress - a public database of microarray experiments and gene expression profiles. Nucleic Acids Research 35: D747–D750. - PMC - PubMed
    1. Mortazavi A, Williams BA, Mccue K, Schaeffer L, Wold B (2008) Mapping and quantifying mammalian transcriptomes by RNA-Seq. Nature Methods 5: 621–628. - PubMed
    1. Cloonan N, Forrest ARR, Kolle G, Gardiner BBA, Faulkner GJ, et al. (2008) Stem cell transcriptome profiling via massive-scale mRNA sequencing. Nature Methods 5: 613–619. - PubMed

Publication types

LinkOut - more resources