Ubiquitous polygenicity of human complex traits: genome-wide analysis of 49 traits in Koreans
- PMID: 23505390
- PMCID: PMC3591292
- DOI: 10.1371/journal.pgen.1003355
Ubiquitous polygenicity of human complex traits: genome-wide analysis of 49 traits in Koreans
Abstract
Recent studies in population of European ancestry have shown that 30% ~ 50% of heritability for human complex traits such as height and body mass index, and common diseases such as schizophrenia and rheumatoid arthritis, can be captured by common SNPs and that genetic variation attributed to chromosomes are in proportion to their length. Using genome-wide estimation and partitioning approaches, we analysed 49 human quantitative traits, many of which are relevant to human diseases, in 7,170 unrelated Korean individuals genotyped on 326,262 SNPs. For 43 of the 49 traits, we estimated a nominally significant (P<0.05) proportion of variance explained by all SNPs on the Affymetrix 5.0 genotyping array ([Formula: see text]). On average across 47 of the 49 traits for which the estimate of h(G)(2) is non-zero, common SNPs explain approximately one-third (range of 7.8% to 76.8%) of narrow sense heritability. The estimate of h(G)(2) is highly correlated with the proportion of SNPs with association P<0.031 (r(2) = 0.92). Longer genomic segments tend to explain more phenotypic variation, with a correlation of 0.78 between the estimate of variance explained by individual chromosomes and their physical length, and 1% of the genome explains approximately 1% of the genetic variance. Despite the fact that there are a few SNPs with large effects for some traits, these results suggest that polygenicity is ubiquitous for most human complex traits and that a substantial proportion of the "missing heritability" is captured by common SNPs.
Conflict of interest statement
The authors have declared that no competing interests exist.
Figures

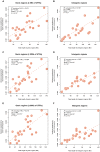
 across 47 traits (all traits except INS0 and HOMA) for a range of threshold p-values. The maximum r value (r
max = 0.960) is at a threshold p-value of 0.031. Panel B): estimates of
  against θ
P at p-value of 0.031 for the 47 traits.
 ) across all the traits, except INS0 and HOMA, for which the estimates of variance explained by all SNPs (
 ) are zero. In panel B), the estimate of
  is weighted by for each trait, i.e.
  , and the length of each chromosome is divided by the total length of the genome, where the intercept (0.008, SE = 0.007) is not significantly different from zero (P = 0.289) and the slope (0.875, SE = 0.150) is not significantly different from 1, which is not significantly different from 1 (P = 0.413).
 ) weighted by the total variance explained by all SNPs (
 ) and averaged across all traits, except INS0 and HOMA, for which the estimates of are zero. The estimates of
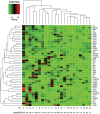
  and the traits were clustered by the hierarchical clustering approach and the heatmap plot was generated by the gplots package in R.
References
-
- Maher B (2008) Personal genomes: The case of the missing heritability. Nature 456: 18–21. - PubMed
Publication types
MeSH terms
LinkOut - more resources
Full Text Sources
Other Literature Sources

