. 2013;8(3):e58296.
doi: 10.1371/journal.pone.0058296. Epub 2013 Mar 7.

FMR1 transcript isoforms: association with polyribosomes; regional and developmental expression in mouse brain

Affiliations

FMR1 transcript isoforms: association with polyribosomes; regional and developmental expression in mouse brain

David M Brackett et al. PLoS One. 2013.

Abstract

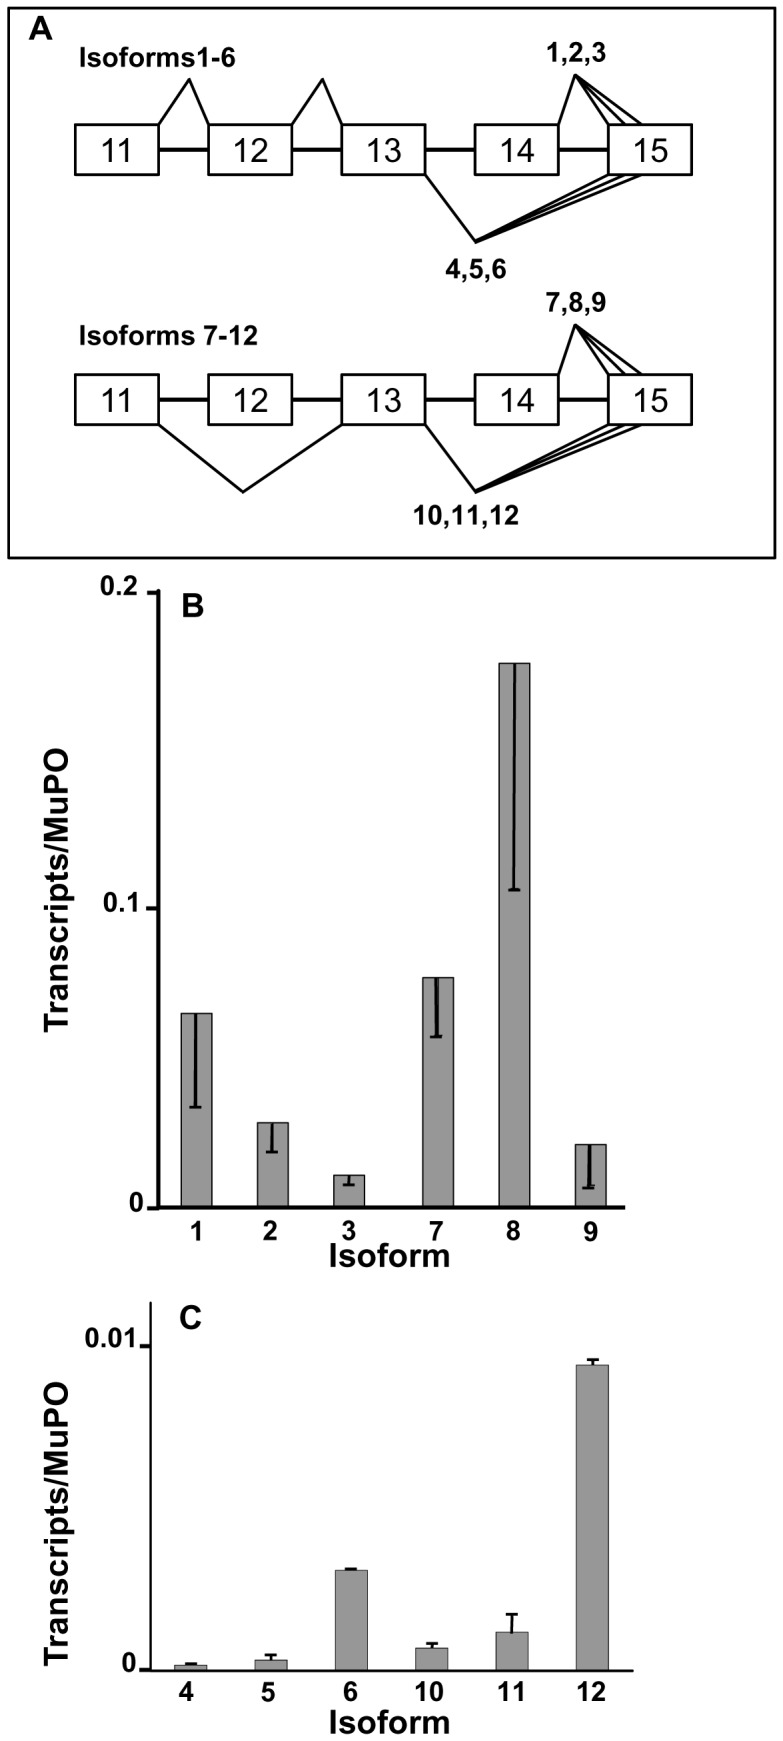
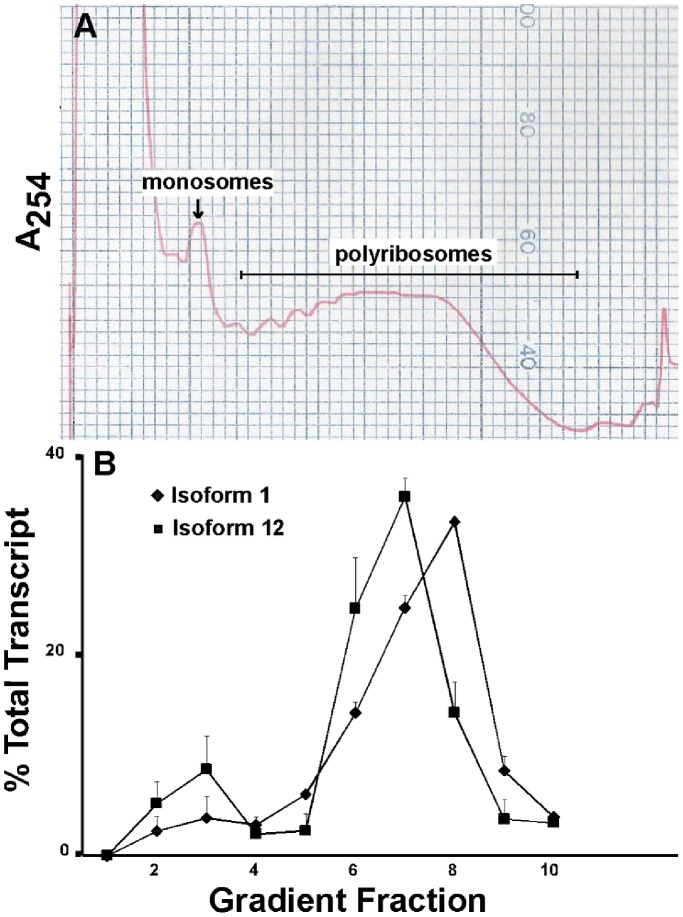
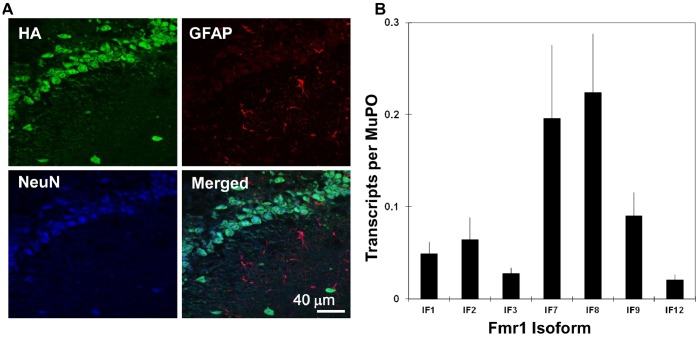
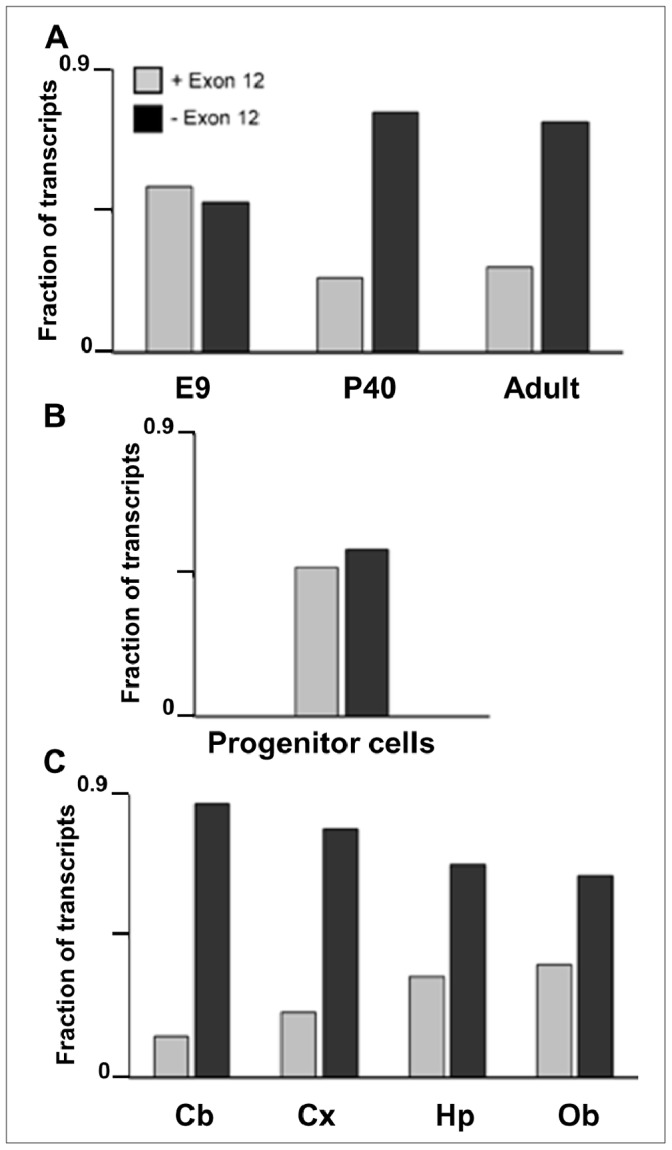
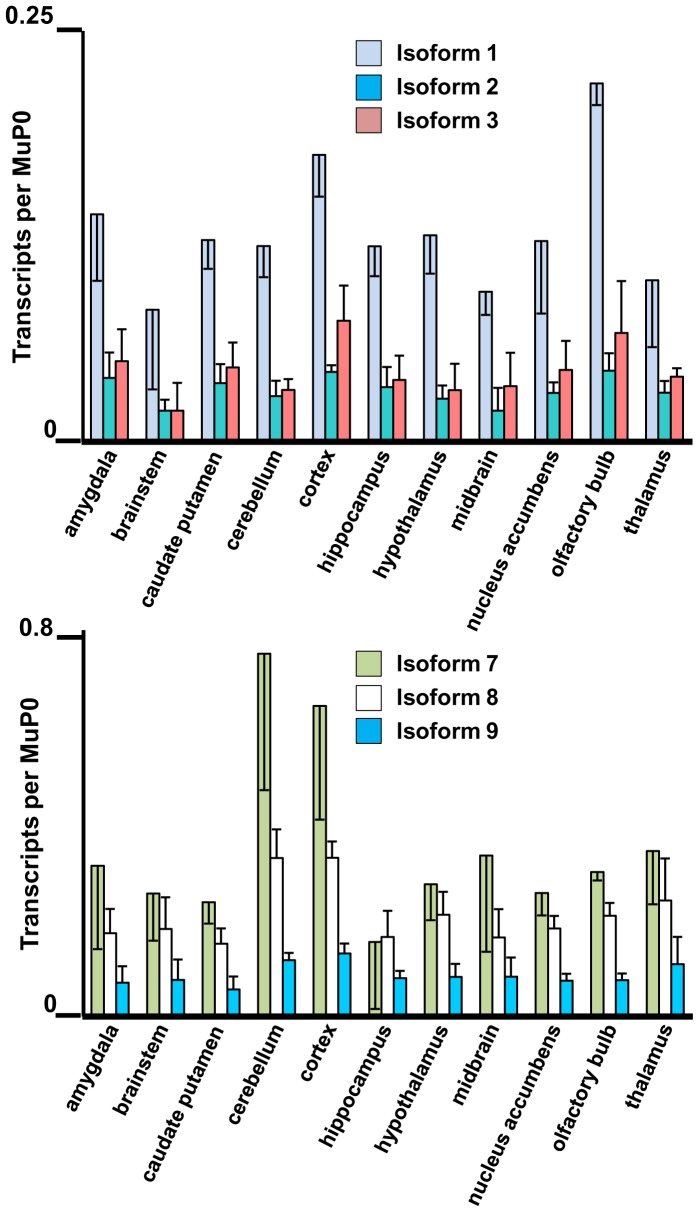
The primary transcript of the mammalian Fragile X Mental Retardation-1 gene (Fmr1), like many transcripts in the central nervous system, is alternatively spliced to yield mRNAs encoding multiple proteins, which can possess quite different biochemical properties. Despite the fact that the relative levels of the 12 Fmr1 transcript isoforms examined here vary by as much as two orders of magnitude amongst themselves in both adult and embryonic mouse brain, all are associated with polyribosomes, consistent with translation into the corresponding isoforms of the protein product, FMRP (Fragile X Mental Retardation Protein). Employing the RiboTag methodology developed in our laboratory, the relative proportions of the 7 most abundant transcript isoforms were measured specifically in neurons and found to be similar to those identified in whole brain. Measurements of isoform profiles across 11 regions of adult brain yielded similar distributions, with the exceptions of the hippocampus and the olfactory bulb. These two regions differ from most of the brain in relative amounts of transcripts encoding an alternate form of one of the KH RNA binding domains. A possible relationship between patterns of expression in the hippocampus and olfactory bulb and the presence of neuroblasts in these two regions is suggested by the isoform patterns in early embryonic brain and in cultured neural progenitor cells. These results demonstrate that the relative levels of the Fmr1 isoforms are modulated according to developmental stage, highlighting the complex ramifications of losing all the protein isoforms in individuals with Fragile X Syndrome. It should also be noted that, of the eight most prominent FMRP isoforms (1-3, 6-9 and 12) in mouse, only two have the major site of phosphorylation at Ser-499, which is thought to be involved in some of the regulatory interactions of this protein.


Conflict of interest statement

Competing Interests: The authors have declared that no competing interests exist.

Figures

Figure 1
Figure 1. Levels of 12 Fmr1 transcript isoforms in adult C57/BL6 wild-type whole brain.
Total RNA was isolated from each brain and a portion was reverse transcribed using a gene specific primer for Fmr1 that is present in all splice variants and a MuP0 gene-specific primer. All values are normalized to MuP0 transcript from each brain (Materials and Methods). [A] Schematic representation of Fmr1 alternative splicing patterns in mouse. [B] Quantification of transcript levels for higher abundance isoforms. Error bars represent standard deviations for biological triplicates. [C] Quantification of transcript levels for lower abundance isoforms. Error bars represent standard deviations of values of triplicate measurements of a single brain. Please see Table 1 for numerical data.
Figure 2
Figure 2. Polyribosome profiles of the longest and shortest Fmr1 transcript isoforms.
An adult mouse was euthanized by CO2 asphyxiation and decapitated. The brain was quickly removed and placed into liquid nitrogen. The brain was then later homogenized (Materials and Methods) and a portion was loaded onto a linear 15–60% sucrose gradient. Fractions were collected by upward displacement. [A] A254 profiles were determined using an ISCO fractionator. [B] Carrier E.coli RNA and UT2 internal standard mRNA was added to each fraction prior to RNA extraction. The amount of RNA lost during extraction was determined by qRT-PCR of the UT2 mRNA (Materials and Methods). Fmr1 isoforms 1 and 12, the longest and shortest forms, were quantified across the sucrose gradient by qRT-PCR. Error bars represent variation in replicate measurements from one brain.
Figure 3
Figure 3. Fmr1 transcript isoforms enriched on neuron-specific ribosomes from adult mouse brain.
The neuron-specific, ribosome-bound transcripts were enriched using the RiboTag methodology as described in the text. (A) Immunohistochemistry on paraformaldehyde fixed coronal brain sections from Eno2-Cre:RiboTag mice demonstrating neural specific expression of Rpl22-HA (HA staining); sections are stained with the neuronal marker NeuN and counterstained with the glial specific marker GFAP. Overlap of NeuN and HA staining and absence of overlapping HA and GFAP staining supports neuron-specific labeling of ribosomes. This particular section corresponds to the dentate gyrus area of the hippocampus. Immunohistochemistry in cortex, striatum and other brain regions was similar to the image shown, suggesting that HA staining is specific to neurons. Scale Bar = 40 microns. (B) The Fmr1 transcript isoforms were isolated from immuno-purified polyribosomes and quantified by qRT-PCR as in Fig. 1. The results are averaged values from five independent, neuron-tagged mice. The average degree of neuronal enrichment of the tagged ribosomes over these five experiments was 3.2±0.7 fold, as estimated using the neuron-specific transcript from the NeuN gene (Fig. S4).
Figure 4
Figure 4. Expression of the major Fmr1 isoforms during mouse brain development.
Brains were harvested in triplicate from male littermates and Fmr1 transcript isoforms were quantified as described in Materials and Methods. The data for all time points (except P7) are averages of biological triplicates and error bars represent the standard deviation in the biological triplicates. The values for P7 are an average of two brains, and the error bars represent the range in data.
Figure 5
Figure 5. Exon 12 in Fmr1 transcripts from mouse brain and cultured progenitor cells.
The levels of the abundant Fmr1 transcripts were measured in [A] embryonic day 9 (E9), postnatal day 40 (P40) and adult mouse brains, in [B] cultured neural stem/progenitor cells, and in [C] dissected regions of adult mouse brain [cerebellum (Cb), cortex (Cx), hippocampus (Hip), and olfactory bulb (Ob)]. The data are presented as the fractions of Fmr1 transcripts containing (gray bars) and lacking (black bars) Exon 12 (eg. “+ Exon 12″ is the sum of Isoforms 1–3 divided by the sum of Isoforms 1–3 plus 7–9). Error bars for the individual isoforms are found in Fig. 1 for adult whole brain, in Fig. 4 for E9 and P40, in Fig. 6 for cultured neural stem/progenitor cells, and in Figs. 7 and 8 for individual brain sections.
Figure 6
Figure 6. The abundant Fmr1 transcript isoforms in cultured neural stem/progenitor cells
. Neural stem/progenitor cells were maintained as described in Materials and Methods. An unstained phase contrast micrograph of the cultured cells is shown in [A]. Levels of the most abundant transcript isoforms were determined in triplicate biological samples and the error bars represent standard deviations of the means [B].
Figure 7
Figure 7. Highly expressed Fmr1 transcript isoforms in eleven brain regions.
The amygdala, brainstem, caudate putamen, cerebellum, cortex, hippocampus, hypothalamus, midbrain, nucleus accumbens, olfactory bulb and thalamus were dissected from three adult mouse brains. The levels of the abundant Fmr1 transcripts are shown with standard deviations in biological triplicates.
Figure 8
Figure 8. Low expressed Fmr1 transcript isoforms in eleven brain regions.
Data for isoforms 4–6 and 10–12 are as indicated. The brain regions are defined in the legend to Fig. 7.

References

    1. Stetefeld J, Ruegg MA (2005) Structural and functional diversity generated by alternative mRNA splicing. Trends Biochem Sci 30: 515–521. - PubMed
    1. Lipscombe D (2005) Neuronal proteins custom designed by alternative splicing. Curr Opin Neurobiol 15: 358–363. - PubMed
    1. Raymond CK, Castle J, Garrett-Engele P, Armour CD, Kan Z, et al. (2004) Expression of alternatively spliced sodium channel alpha-subunit genes. Unique splicing patterns are observed in dorsal root ganglia. J Biol Chem 279: 46234–46241. - PubMed
    1. Ule J, Darnell RB (2006) RNA binding proteins and the regulation of neuronal synaptic plasticity. Curr Opin Neurobiol 16: 102–110. - PubMed
    1. Chetkovich DM, Bunn RC, Kuo SH, Kawasaki Y, Kohwi M, et al. (2002) Postsynaptic targeting of alternative postsynaptic density-95 isoforms by distinct mechanisms. J Neurosci 22: 6415–6425. - PMC - PubMed

Publication types