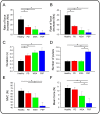
Force control deficits in individuals with Parkinson's disease, multiple systems atrophy, and progressive supranuclear palsy
- PMID: 23505500
- PMCID: PMC3594313
- DOI: 10.1371/journal.pone.0058403
Force control deficits in individuals with Parkinson's disease, multiple systems atrophy, and progressive supranuclear palsy
Abstract
Objective: This study examined grip force and cognition in Parkinson's disease (PD), Parkinsonian variant of multiple system atrophy (MSAp), progressive supranuclear palsy (PSP), and healthy controls. PD is characterized by a slower rate of force increase and decrease and the production of abnormally large grip forces. Early-stage PD has difficulty with the rapid contraction and relaxation of hand muscles required for precision gripping. The first goal was to determine which features of grip force are abnormal in MSAp and PSP. The second goal was to determine whether a single variable or a combination of motor and cognitive measures would distinguish patient groups. Since PSP is more cognitively impaired relative to PD and MSAp, we expected that combining motor and cognitive measures would further distinguish PSP from PD and MSAp.
Methods: We studied 44 participants: 12 PD, 12 MSAp, 8 PSP, and 12 controls. Patients were diagnosed by a movement disorders neurologist and were tested off anti-Parkinsonian medication. Participants completed a visually guided grip force task wherein force pulses were produced for 2 s, followed by 1 s of rest. We also conducted four cognitive tests.
Results: PD, MSAp, and PSP were slower at contracting and relaxing force and produced longer pulse durations compared to controls. PSP produced additional force pulses during the task and were more cognitively impaired relative to other groups. A receiver operator characteristic analysis revealed that the combination of number of pulses and Brief Test of Attention (BTA) discriminated PSP from PD, MSAp, and controls with a high degree of sensitivity and specificity.
Conclusions: Slowness in contracting and relaxing force represent general features of PD, MSAp, and PSP, whereas producing additional force pulses was specific to PSP. Combining motor and cognitive measures provides a robust method for characterizing behavioral features of PSP compared to MSAp and PD.
Conflict of interest statement
Figures


Similar articles
-
Montreal Cognitive Assessment (MoCA) and Mini-Mental State Examination (MMSE) performance in progressive supranuclear palsy and multiple system atrophy.J Neural Transm (Vienna). 2016 Dec;123(12):1435-1442. doi: 10.1007/s00702-016-1589-3. Epub 2016 Jun 22. J Neural Transm (Vienna). 2016. PMID: 27334897
-
Comparison of autonomic dysfunction in patients with Parkinson's Disease, progressive supranuclear palsy, and multiple system atrophy.Neurol Neurochir Pol. 2024;58(2):193-202. doi: 10.5603/pjnns.96939. Epub 2023 Dec 27. Neurol Neurochir Pol. 2024. PMID: 38148738
-
Characteristics and progression of cognitive deficits in progressive supranuclear palsy vs. multiple system atrophy and Parkinson's disease.J Neural Transm (Vienna). 2019 Nov;126(11):1437-1445. doi: 10.1007/s00702-019-02065-1. Epub 2019 Aug 20. J Neural Transm (Vienna). 2019. PMID: 31432258
-
Diagnostic criteria for multiple system atrophy and progressive supranuclear palsy.Rev Neurol (Paris). 2010 Oct;166(10):829-33. doi: 10.1016/j.neurol.2010.07.004. Epub 2010 Sep 1. Rev Neurol (Paris). 2010. PMID: 20813385 Review.
-
Nonmotor Features in Atypical Parkinsonism.Int Rev Neurobiol. 2017;134:1285-1301. doi: 10.1016/bs.irn.2017.06.001. Epub 2017 Jul 3. Int Rev Neurobiol. 2017. PMID: 28805573 Review.
Cited by
-
Memory-guided force output is associated with self-reported ADHD symptoms in young adults.Exp Brain Res. 2016 Nov;234(11):3203-3212. doi: 10.1007/s00221-016-4718-1. Epub 2016 Jul 9. Exp Brain Res. 2016. PMID: 27394915 Free PMC article.
-
Grip force release is impaired in parkinson's disease during a force tracking task.Exp Brain Res. 2024 Dec 5;243(1):16. doi: 10.1007/s00221-024-06966-w. Exp Brain Res. 2024. PMID: 39636326
-
An Acute Application of Cerebellar Transcranial Direct Current Stimulation Does Not Improve Motor Performance in Parkinson's Disease.Brain Sci. 2020 Oct 14;10(10):735. doi: 10.3390/brainsci10100735. Brain Sci. 2020. PMID: 33066348 Free PMC article.
-
A Single Application of Cerebellar Transcranial Direct Current Stimulation Fails to Enhance Motor Skill Acquisition in Parkinson's Disease: A Pilot Study.Biomedicines. 2023 Aug 8;11(8):2219. doi: 10.3390/biomedicines11082219. Biomedicines. 2023. PMID: 37626716 Free PMC article.
-
Cortical beta oscillations help synchronise muscles during static posture holding in healthy motor control.Neuroimage. 2024 Sep;298:120774. doi: 10.1016/j.neuroimage.2024.120774. Epub 2024 Aug 3. Neuroimage. 2024. PMID: 39103065 Free PMC article.
References
-
- Marras C, McDermott MP, Rochon PA, Tanner CM, Naglie G, et al. (2005) Survival in Parkinson disease: thirteen-year follow-up of the DATATOP cohort. Neurology 64: 87–93. - PubMed
-
- Wenning GK, Litvan I, Tolosa E (2011) Milestones in atypical and secondary Parkinsonisms. Movement disorders : official journal of the Movement Disorder Society 26: 1083–1095. - PubMed
-
- Freund HJ, Budingen HJ (1978) The relationship between speed and amplitude of the fastest voluntary contractions of human arm muscles. Experimental brain research Experimentelle Hirnforschung Experimentation cerebrale 31: 1–12. - PubMed
-
- Gordon J, Ghez C (1987) Trajectory control in targeted force impulses. II. Pulse height control. Experimental brain research Experimentelle Hirnforschung Experimentation cerebrale 67: 241–252. - PubMed
Publication types
MeSH terms
Grants and funding
LinkOut - more resources
Full Text Sources
Other Literature Sources
Medical
Miscellaneous

