

Circadian clock gene Per2 is not necessary for the photoperiodic response in mice
- PMID: 23505514
- PMCID: PMC3591342
- DOI: 10.1371/journal.pone.0058482
Circadian clock gene Per2 is not necessary for the photoperiodic response in mice
Abstract
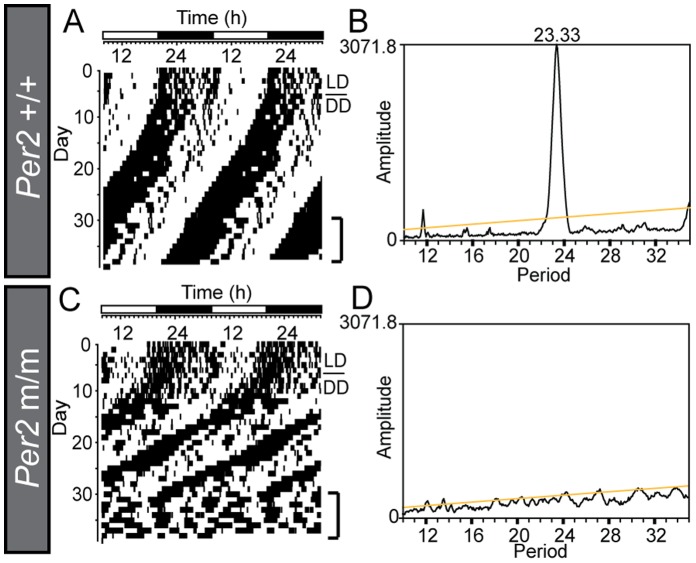
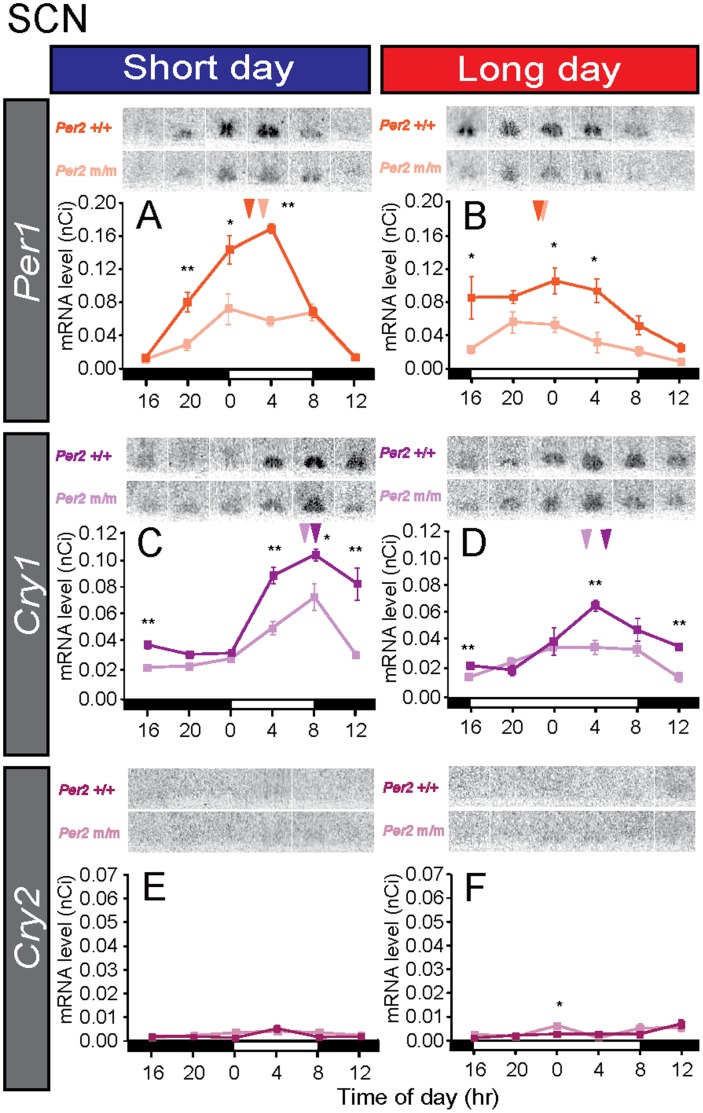
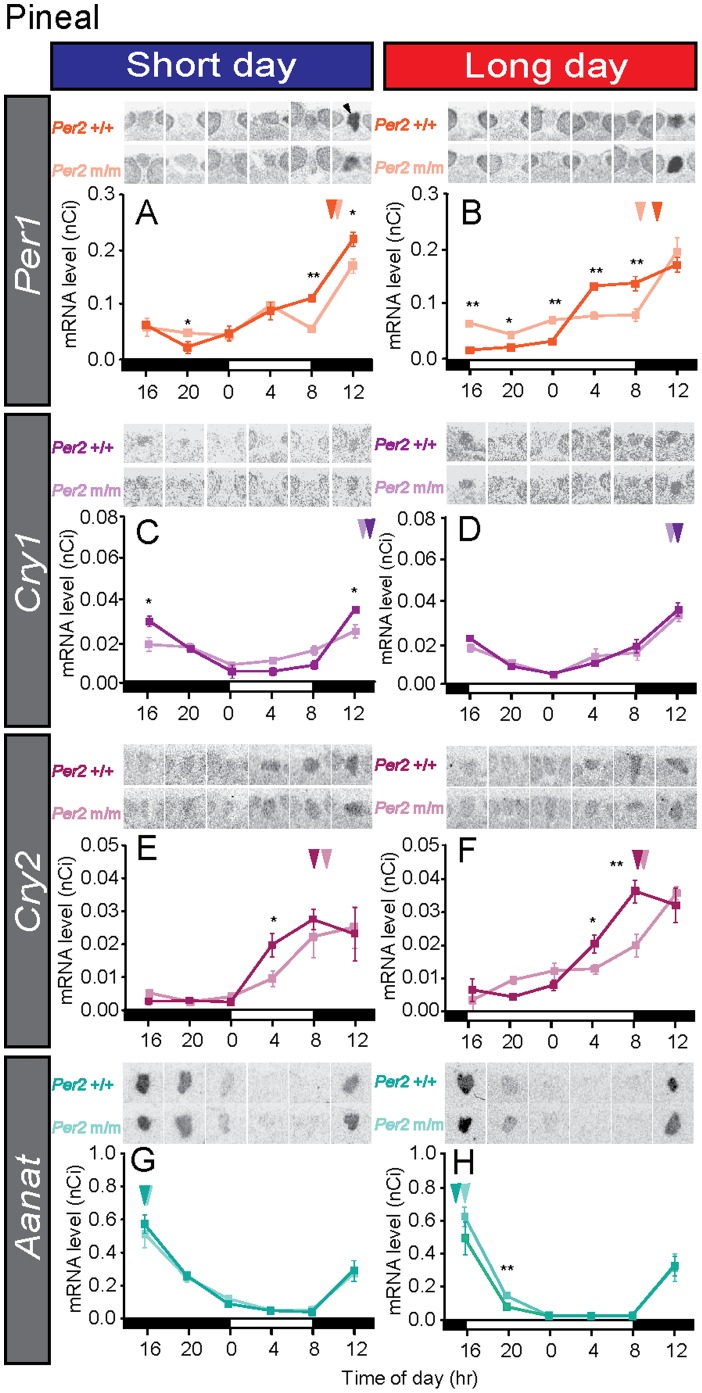
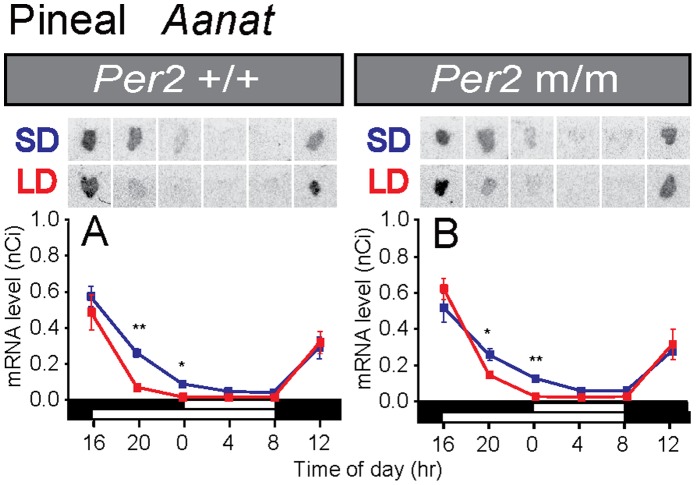
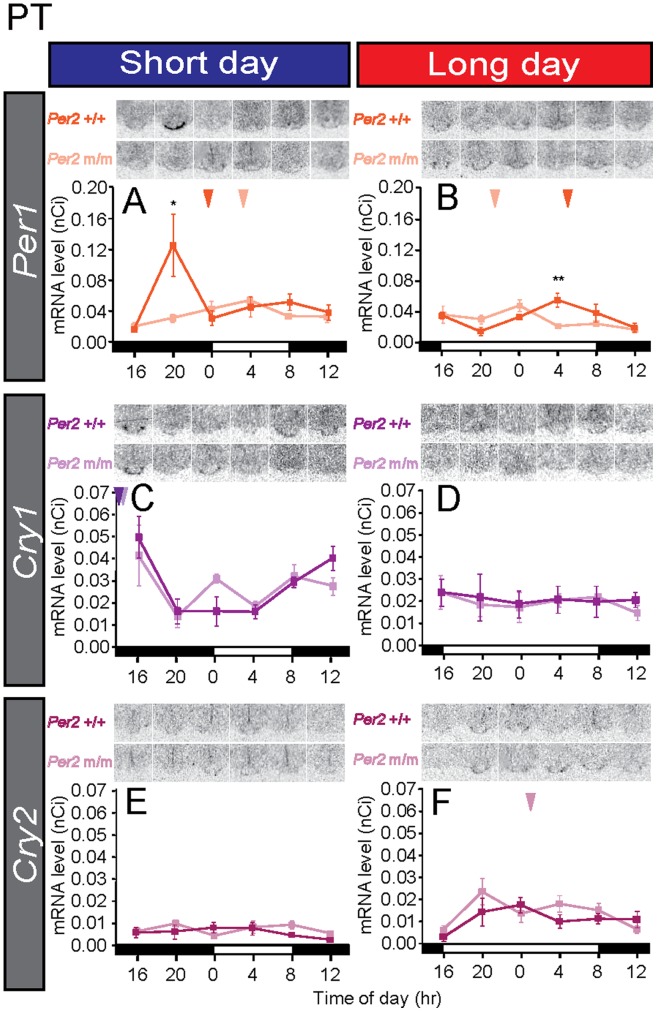
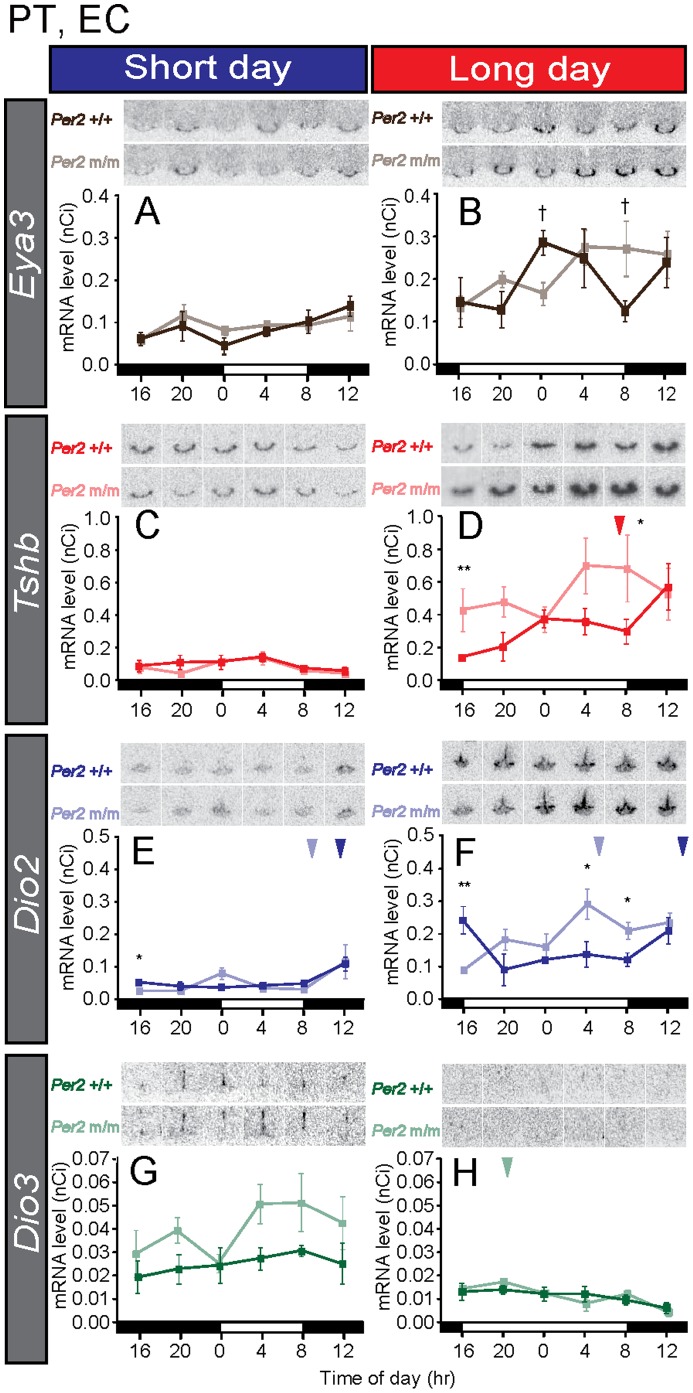
In mammals, light information received by the eyes is transmitted to the pineal gland via the circadian pacemaker, i.e., the suprachiasmatic nucleus (SCN). Melatonin secreted by the pineal gland at night decodes night length and regulates seasonal physiology and behavior. Melatonin regulates the expression of the β-subunit of thyroid-stimulating hormone (TSH; Tshb) in the pars tuberalis (PT) of the pituitary gland. Long day-induced PT TSH acts on ependymal cells in the mediobasal hypothalamus to induce the expression of type 2 deiodinase (Dio2) and reduce type 3 deiodinase (Dio3) that are thyroid hormone-activating and hormone-inactivating enzymes, respectively. The long day-activated thyroid hormone T3 regulates seasonal gonadotropin-releasing hormone secretion. It is well established that the circadian clock is involved in the regulation of photoperiodism. However, the involvement of the circadian clock gene in photoperiodism regulation remains unclear. Although mice are generally considered non-seasonal animals, it was recently demonstrated that mice are a good model for the study of photoperiodism. In the present study, therefore, we examined the effect of changing day length in Per2 deletion mutant mice that show shorter wheel-running rhythms under constant darkness followed by arhythmicity. Although the amplitude of clock gene (Per1, Cry1) expression was greatly attenuated in the SCN, the expression profile of arylalkylamine N-acetyltransferase, a rate-limiting melatonin synthesis enzyme, was unaffected in the pineal gland, and robust photoperiodic responses of the Tshb, Dio2, and Dio3 genes were observed. These results suggested that the Per2 clock gene is not necessary for the photoperiodic response in mice.
Conflict of interest statement
Figures
Similar articles
-
Photoperiod regulates multiple gene expression in the suprachiasmatic nuclei and pars tuberalis of the Siberian hamster (Phodopus sungorus).Eur J Neurosci. 2005 Jun;21(11):2967-74. doi: 10.1111/j.1460-9568.2005.04148.x. Eur J Neurosci. 2005. PMID: 15978008
-
Temporal expression of seven clock genes in the suprachiasmatic nucleus and the pars tuberalis of the sheep: evidence for an internal coincidence timer.Proc Natl Acad Sci U S A. 2002 Oct 15;99(21):13890-5. doi: 10.1073/pnas.212517599. Epub 2002 Oct 8. Proc Natl Acad Sci U S A. 2002. PMID: 12374857 Free PMC article.
-
Circadian clocks and the measurement of daylength in seasonal reproduction.Mol Cell Endocrinol. 2012 Feb 5;349(1):76-81. doi: 10.1016/j.mce.2011.06.040. Epub 2011 Jul 13. Mol Cell Endocrinol. 2012. PMID: 21767603 Review.
-
Melatonin adjusts the expression pattern of clock genes in the suprachiasmatic nucleus and induces antidepressant-like effect in a mouse model of seasonal affective disorder.Chronobiol Int. 2015 May;32(4):447-57. doi: 10.3109/07420528.2014.992525. Epub 2014 Dec 17. Chronobiol Int. 2015. PMID: 25515595
-
Melatonin feedback on clock genes: a theory involving the proteasome.J Pineal Res. 2015 Jan;58(1):1-11. doi: 10.1111/jpi.12189. Epub 2014 Nov 22. J Pineal Res. 2015. PMID: 25369242 Review.
Cited by
-
Major oscillations in spontaneous home-cage activity in C57BL/6 mice housed under constant conditions.Sci Rep. 2021 Mar 2;11(1):4961. doi: 10.1038/s41598-021-84141-9. Sci Rep. 2021. PMID: 33654141 Free PMC article.
-
Effect of summer daylight exposure and genetic background on growth in growth hormone-deficient children.Pharmacogenomics J. 2016 Nov;16(6):540-550. doi: 10.1038/tpj.2015.67. Epub 2015 Oct 27. Pharmacogenomics J. 2016. PMID: 26503811 Free PMC article.
-
Clocks for all seasons: unwinding the roles and mechanisms of circadian and interval timers in the hypothalamus and pituitary.J Endocrinol. 2014 Aug;222(2):R39-59. doi: 10.1530/JOE-14-0141. Epub 2014 Jun 2. J Endocrinol. 2014. PMID: 24891434 Free PMC article. Review.
-
Sustained Accumulation of Molecular Clock Suppressors Period 1 and Period 2 Promotes C2C12 Myotube Atrophy Through an Autocrine-Mediated Mechanism With Relevance to Androgen Deprivation-Induced Limb Muscle Mass Loss.Function (Oxf). 2025 Aug 1;6(4):zqaf030. doi: 10.1093/function/zqaf030. Function (Oxf). 2025. PMID: 40632504 Free PMC article.
-
Radiation chronotherapy-clinical impact of treatment time-of-day: a systematic review.J Neurooncol. 2019 Dec;145(3):415-427. doi: 10.1007/s11060-019-03332-7. Epub 2019 Nov 15. J Neurooncol. 2019. PMID: 31729636 Free PMC article.
References
-
- Keast JA, Marshall AJ (1954) Reproduction in Australian desert birds. Proc Zool Soc Lond 124: 493–499.
-
- Hamner WM (1966) Photoperiodic control of the annual testicular cycle in the houce finch, Carpodacus mexicanus . Gen Comp Endocrinol 7: 224–233.
-
- Bronson FH (1985) Mammalian reproduction: an ecological perspective. Biol Reprod 32: 1–26. - PubMed
-
- Zann RA, Morton SR, Jones KR, Burley NT (1995) The timing of breeding in zebra finches in relation to rainfall in Central Australia. Emu 95: 208–222.
-
- Dawson A, Sharp PJ (2007) Photorefractoriness in birds–photoperiodic and non-photoperiodic control. Gen Comp Endocrinol 153: 378–384. - PubMed
Publication types
MeSH terms
Substances
LinkOut - more resources
Full Text Sources
Other Literature Sources
Molecular Biology Databases
Research Materials
Miscellaneous
