. 2013;8(3):e58756.
doi: 10.1371/journal.pone.0058756. Epub 2013 Mar 7.

Human Mas-related G protein-coupled receptors-X1 induce chemokine receptor 2 expression in rat dorsal root ganglia neurons and release of chemokine ligand 2 from the human LAD-2 mast cell line

Affiliations

Human Mas-related G protein-coupled receptors-X1 induce chemokine receptor 2 expression in rat dorsal root ganglia neurons and release of chemokine ligand 2 from the human LAD-2 mast cell line

Hans Jürgen Solinski et al. PLoS One. 2013.

Abstract

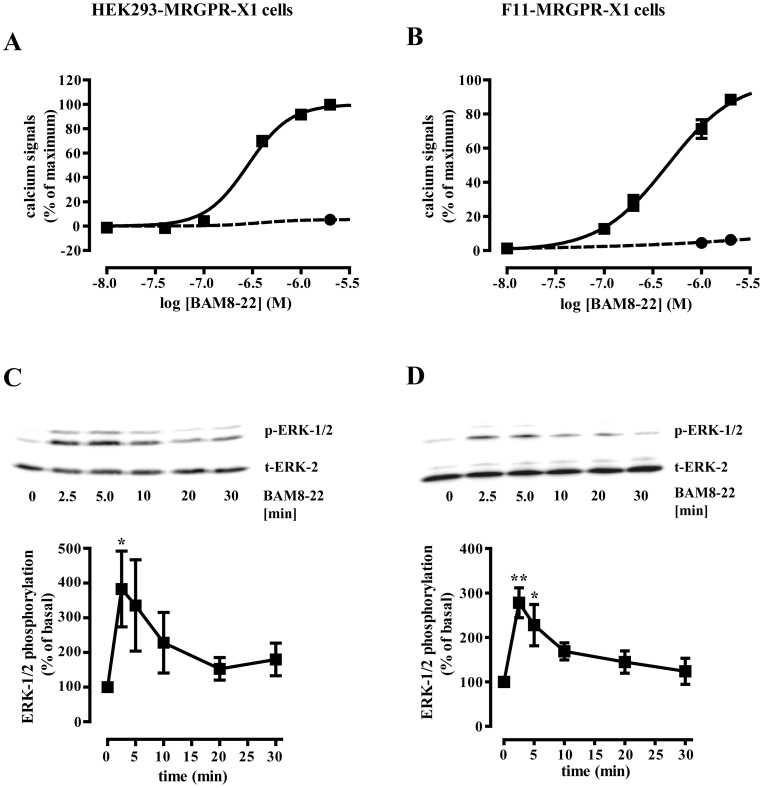
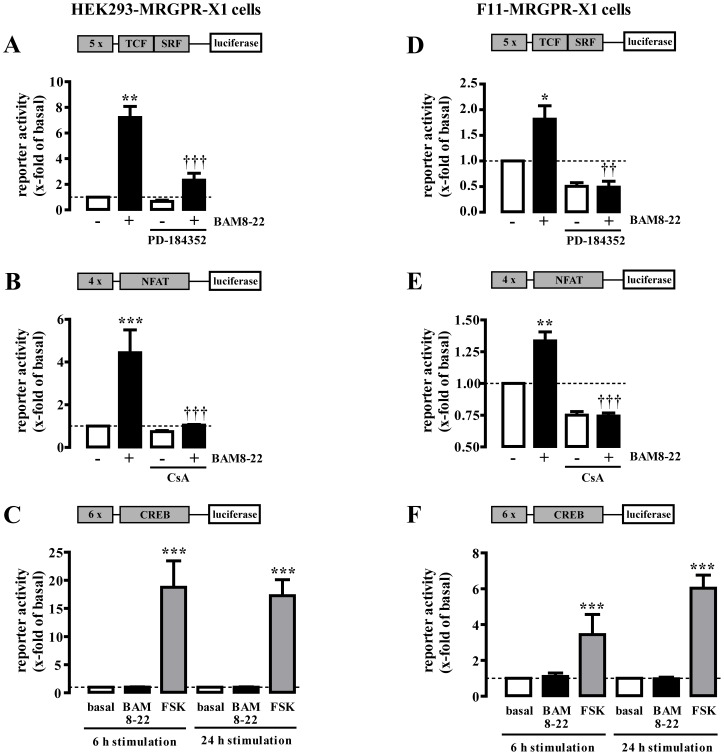
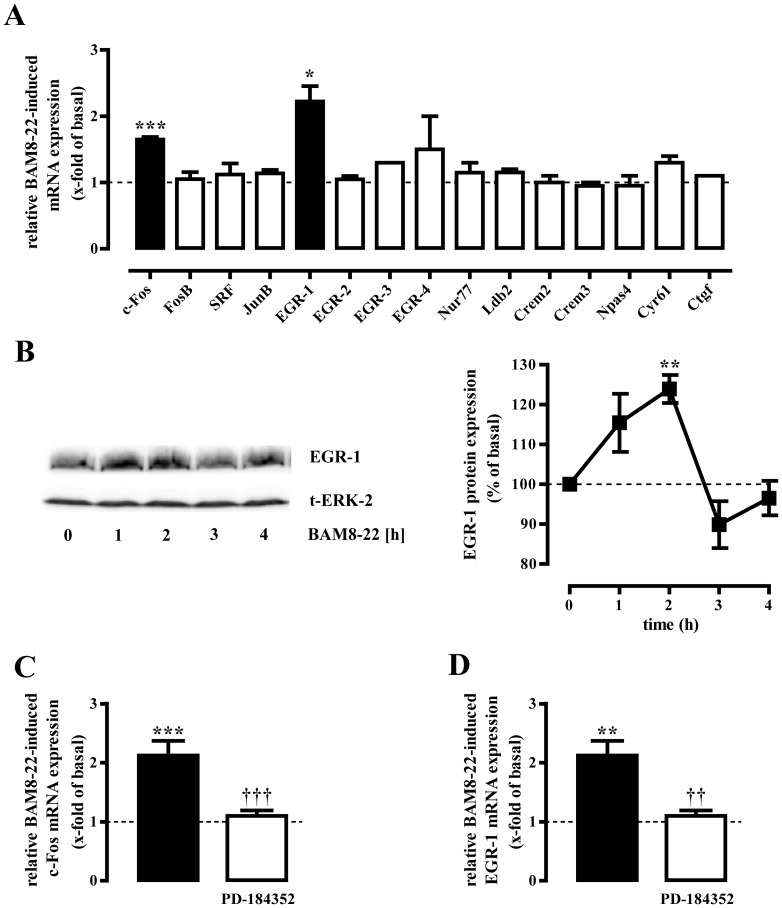
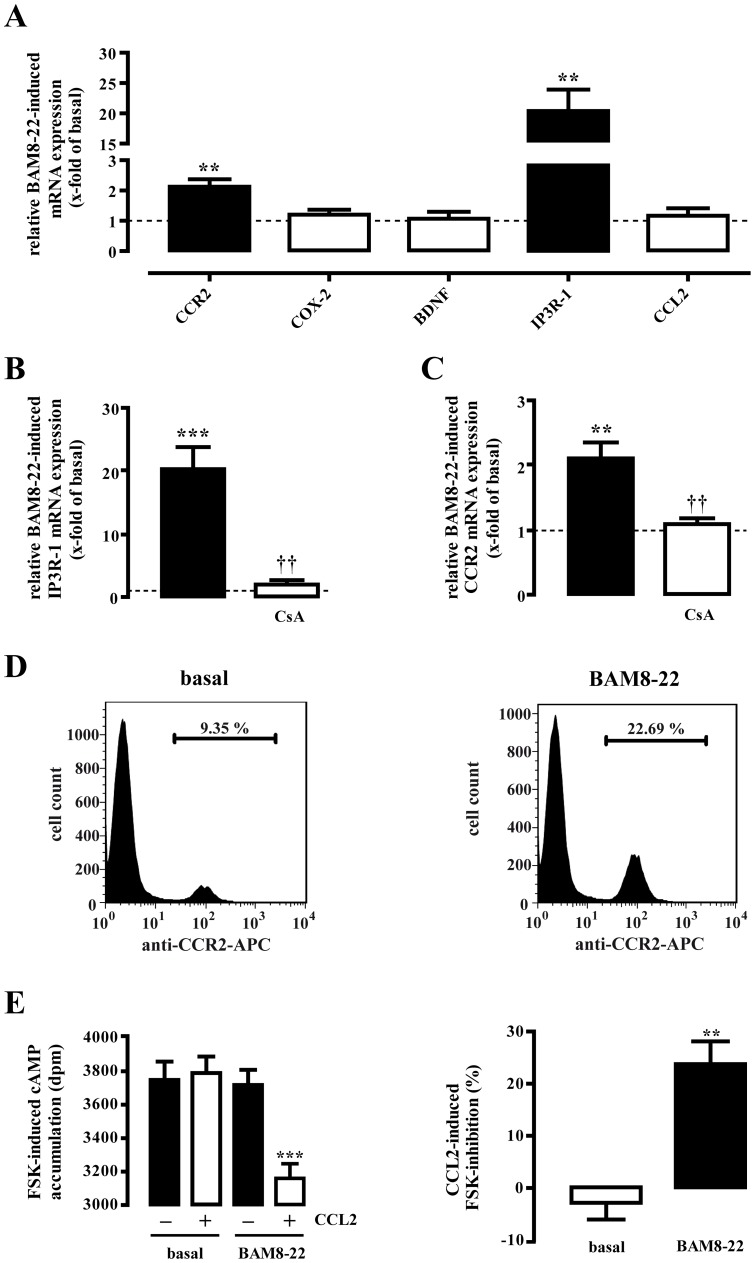
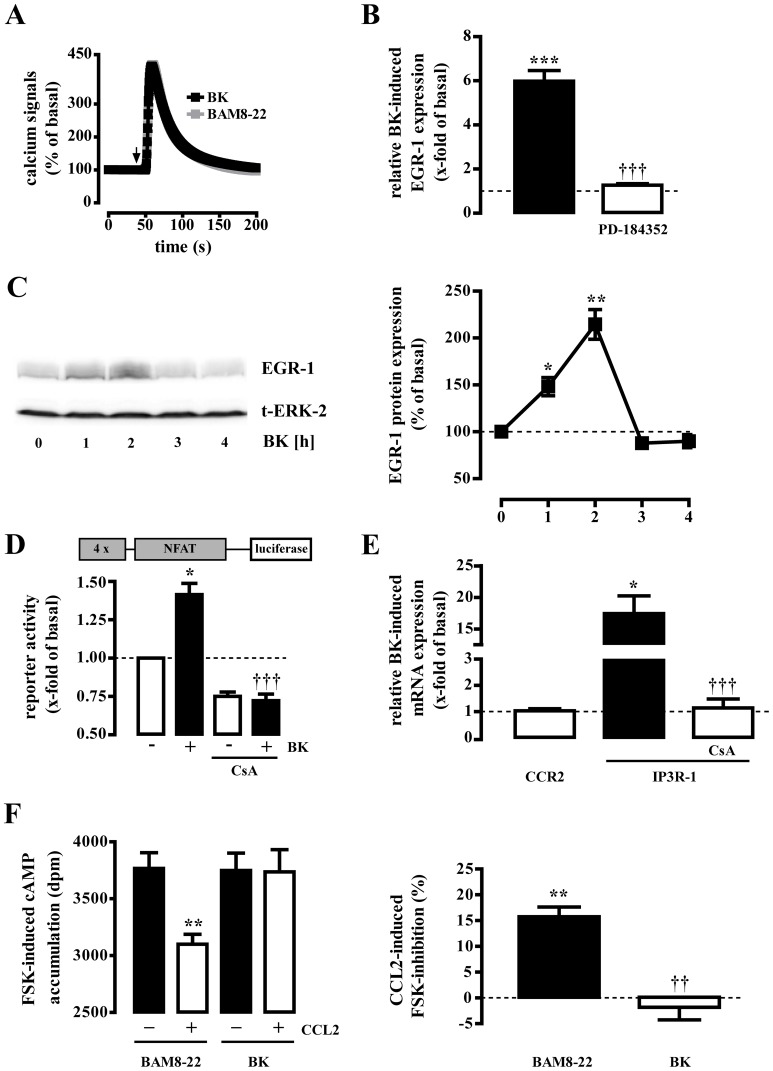
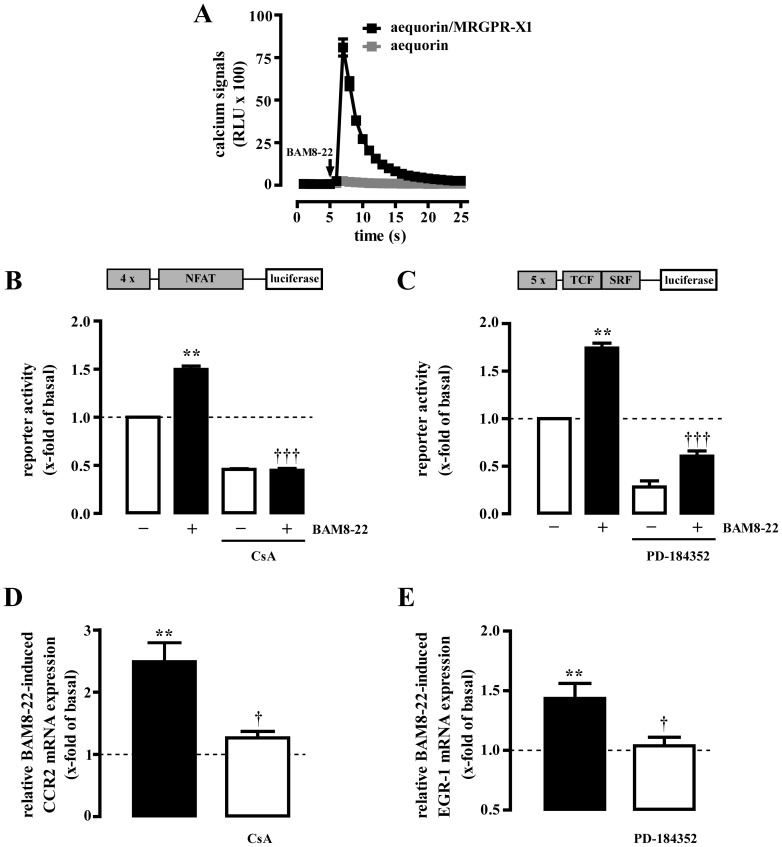
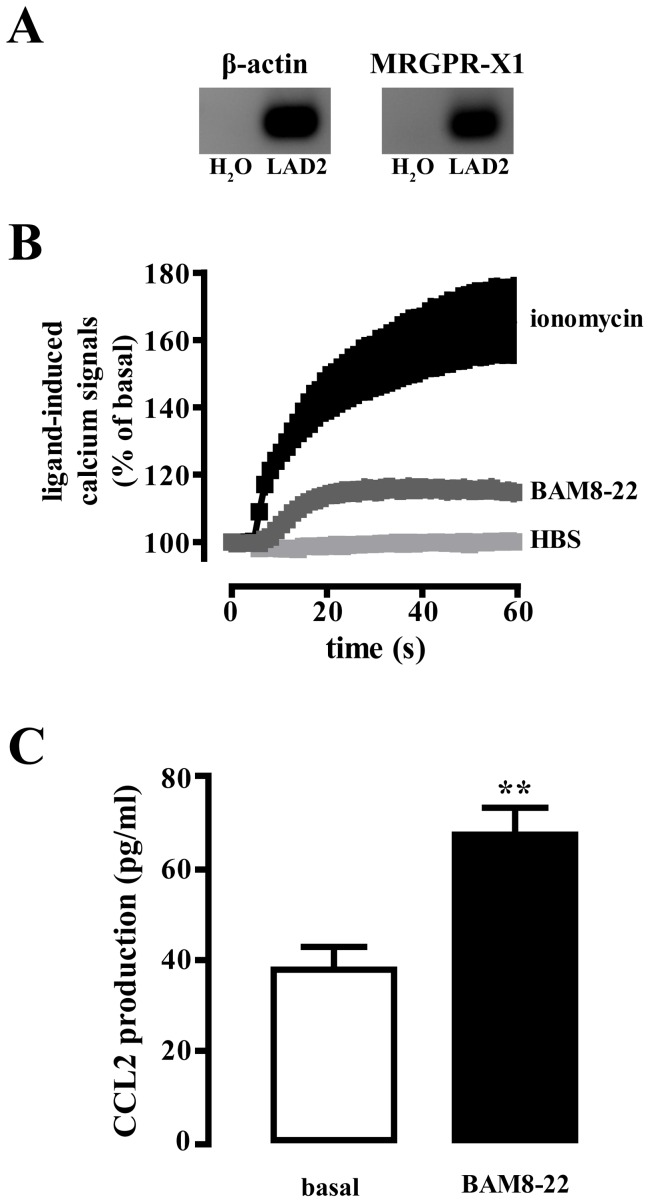
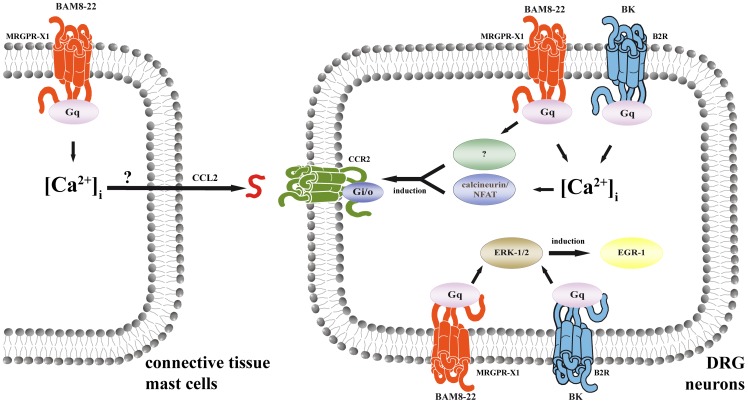
Primate-specific Mas-related G protein-coupled receptors-X1 (MRGPR-X1) are highly enriched in dorsal root ganglia (DRG) neurons and induce acute pain. Herein, we analyzed effects of MRGPR-X1 on serum response factors (SRF) or nuclear factors of activated T cells (NFAT), which control expression of various markers of chronic pain. Using HEK293, DRG neuron-derived F11 cells and cultured rat DRG neurons recombinantly expressing human MRGPR-X1, we found activation of a SRF reporter gene construct and induction of the early growth response protein-1 via extracellular signal-regulated kinases-1/2 known to play a significant role in the development of inflammatory pain. Furthermore, we observed MRGPR-X1-induced up-regulation of the chemokine receptor 2 (CCR2) via NFAT, which is considered as a key event in the onset of neuropathic pain and, so far, has not yet been described for any endogenous neuropeptide. Up-regulation of CCR2 is often associated with increased release of its endogenous agonist chemokine ligand 2 (CCL2). We also found MRGPR-X1-promoted release of CCL2 in a human connective tissue mast cell line endogenously expressing MRGPR-X1. Thus, we provide first evidence to suggest that MRGPR-X1 induce expression of chronic pain markers in DRG neurons and propose a so far unidentified signaling circuit that enhances chemokine signaling by acting on two distinct yet functionally co-operating cell types. Given the important role of chemokine signaling in pain chronification, we propose that interruption of this signaling circuit might be a promising new strategy to alleviate chemokine-promoted pain.


Conflict of interest statement

Competing Interests: The authors have declared that no competing interests exist.

Figures

Figure 1
Figure 1. MRGPR-X1 stimulate ERK-1/2 in HEK293- and F11-MRGPR-X1 cells.
Concentration response curves of BAM8-22-promoted calcium signals in fura2-loaded HEK293-MRGPR-X1 (A) or in F11-MRGPR-X1 (B) cells (squares) or mock cells (circles) are shown. BAM8-22-induced (1 µM) phosphorylation of ERK-1/2 in HEK293-MRGPR-X1 (C) or in F11-MRGPR-X1 (D) cells was analyzed by western-blotting using a phospho-specific antibody (p-ERK-1/2). Afterwards blots were stripped and re-probed with an antibody against ERK-2 (t-ERK-2). One representative blot is shown. Ligand-induced ERK-1/2 phosphorylation was quantified by densitometry and is given normalized to not stimulated cells. Data from 4 experiments were compiled and expressed as the mean ± S.E.M. Asterisks indicate significant differences to not stimulated cells.
Figure 2
Figure 2. MRGPR-X1 stimulate TCF/SRF- and NFAT-dependent reporter in HEK293- and F11-MRGPR-X1 cells.
TCF/SRF-, NFAT- or CREB-dependent reporter gene constructs were transfected into HEK293-MRGPR-X1 (A–C) or in F11-MRGPR-X1 (D–F) cells. Cells were stimulated with 1 µM BAM8-22 for 6 h or as indicated. 5 µM FSK was used as a control for the CREB reporter. CsA (1 µM, 30 min) was used to block the NFAT activator calcineurin and PD-184352 (10 µM, 30 min) to block ERK-1/2 activity. Data from 3–5 independent experiments performed in triplicates were compiled and expressed as the mean ± S.E.M. Asterisks indicate significant differences to not stimulated cells. Dagger signs indicate significant differences between BAM8-22-stimulated inhibitor-treated and untreated cells.
Figure 3
Figure 3. MRGPR-X1 induce EGR-1 via ERK-1/2 in F11-MRGPR-X1 cells.
RTQ-PCR experiments were performed with cDNAs derived from serum-starved F11-MRGPR-X1 cells stimulated or not with BAM8-22 (1 µM) for 1 h (A, C and D) using specific primers for 15 distinct genes as indicated in table 1. The name of the analyzed gene is listed beneath the corresponding bar. Genes with a p value <0.05 are show in black bars. In (C and D) cells were treated or not with PD-184352 (30 min, 10 µM). Relative BAM8-22-induced gene expression was normalized to β-actin and calculated using the ΔΔCp method. In (B) serum-starved F11-MRGPR-X1 cells were stimulated or not with BAM8-22 (1 µM) for the indicated period of time and expression of EGR-1 was determined by western-blotting. Afterwards blots were stripped and re-probed with an antibody against ERK-2 (t-ERK-2). One representative blot is shown. Ligand-induced EGR-1 expression was quantified by densitometry and is given normalized to not stimulated cells. Data from 4 independent experiments were compiled and expressed as the mean ± S.E.M. Asterisk indicate a significant difference to not stimulated cells. Dagger signs indicate a significant difference between BAM8-22-stimulated inhibitor-treated and untreated cells.
Figure 4
Figure 4. MRGPR-X1 induce CCR2 via NFAT in F11-MRGPR-X1 cells.
RTQ-PCR experiments were performed with cDNAs derived from serum-starved F11-MRGPR-X1 cells stimulated or not with BAM8-22 (1 µM) for 6 h (A-C) using specific primers for 5 distinct genes as indicated in table 1. The name of the analyzed gene is listed beneath the corresponding bar. Genes with a p value <0.05 are show in black bars. In (B and C) cells were treated or not with CsA (1 µM, 30 min). Relative BAM8-22-induced gene expression was normalized to β-actin and calculated using the ΔΔCp method. Data from 4 independent experiments were compiled and expressed as the mean ± S.E.M. BAM8-22-induced (1 µM, 20 h) CCR2 protein expression in F11-MRGPR-X1 cells was assessed by flow cytometry (D) or by CCL2-promoted (100 ng/ml) inhibition of FSK-induced (5 µM) cAMP accumulation (E). In (D) one representative experiment is shown. Accumulation of the data from 5 independent experiments revealed an increase in the number of CCR2 positive cells by 10.8±1.4% after BAM8-22 stimulation. In (E, left panel) one representative experiment is shown and in (E, right panel) data from 5 independent experiments performed in triplicates were compiled and expressed as the mean ± S.E.M. Asterisks indicate a significant difference to not stimulated cells. Dagger signs indicate a significant difference between BAM8-22-stimulated inhibitor-treated and untreated cells.
Figure 5
Figure 5. B2R do not induce CCR2 despite NFAT activation.
(A) BAM8-22- (2 µM) or BK-induced (1 µM) calcium signals were determined in single fura2-loaded F11-MRGPR-X1 cells by calcium imaging. Data of ∼300 cells were compiled and expressed as the mean ± S.E.M. RTQ-PCR experiments were performed with cDNAs derived from serum-starved F11-MRGPR-X1 cells stimulated or not with BK (1 µM) for 1 h in (B) or 6 h in (E). Relative BK-induced gene expression was normalized to β-actin, calculated using the ΔΔCp method, and expressed as the mean ± S.E.M. (C) Serum-starved F11-MRGPR-X1 cells were stimulated or not with BK (1 µM) for the indicated period of time and expression of EGR-1 was determined by western-blotting. Afterwards blots were stripped and re-probed with an antibody against ERK-2 (t-ERK-2). One representative blot is shown. Ligand-induced EGR-1 expression was quantified by densitometry and is given normalized to not stimulated cells as the mean ± S.E.M. (D) BK-induced (1 µM, 6 h) activation of the NFAT reporter is shown in F11-MRGPR-X1 cells. Data are expressed as the mean ± S.E.M. PD-184352 (10 µM, 30 min) was used to inhibit ERK-1/2 activity in (B) or CsA (1 µM, 30 min) to block calcineurin in (D and E). In (B–E) 4 independent experiments were conducted, respectively. In (F) CCR2 protein expression in F11-MRGPR-X1 cells was assessed by CCL2-promoted (100 ng/ml) inhibition of FSK-induced (5 µM) cAMP accumulation after pre-stimulation of the cells with BAM8-22 or BK (1 µM, 20 h). In (F, left panel) one representative experiment is shown and in (F, right panel) data from 5 independent experiments performed in triplicates were compiled and expressed as the mean ± S.E.M. Asterisks indicate a significant difference to not stimulated cells. Dagger signs indicate a significant difference between BK-stimulated inhibitor-treated and untreated cells or between BK- and BAM8-22-stimulated cells.
Figure 6
Figure 6. MRGPR-X1 induce EGR-1 via ERK-1/2 and CCR2 via NFAT in primary DRG neurons.
BAM8-22-induced (2 µM) calcium signals in rat DRG neurons co-expressing MRGPR-X1 and aequorin or solely aequorin are presented in (A). BAM8-22-induced (2 µM, 8 h) activation of the NFAT (B) or TCF/SRF (C) reporter is shown in rat DRG neurons transiently co-expressing MRGPR-X1. RTQ-PCR experiments were performed with cDNAs derived from serum-starved MRGPR-X1 expressing rat DRG neurons stimulated or not with BAM8-22 (2 µM) for 6 h (D) or 40 min (E). CsA (1 µM, 30 min) was used to block calcineurin in (B and D) or PD-184352 (10 µM, 30 min) to inhibit ERK-1/2 activity in (C and E). Relative BAM8-22-induced gene expression was normalized to β-actin and calculated using the ΔΔCp method. Data from 4 independent experiments were compiled and expressed as the mean ± S.E.M. Asterisks indicate a significant difference to not stimulated cells. Dagger signs indicate a significant difference between BAM8-22-stimulated inhibitor-treated and untreated cells.
Figure 7
Figure 7. MRGPR-X1-induced CCL2 release in LAD-2 mast cells.
(A) MRGPR-X1 (40 cycles) or β-actin (30 cycles) mRNA expression was determined in LAD-2 cells by RT-PCR. As a negative control, RT-PCR was conducted without addition of cDNA (H2O). (B) Calcium signals in fura2-loaded LAD-2 cells are shown after injection of BAM8-22 (5 µM) or ionomycin (5 µM) or HBS as positive or negative control, respectively. (C) CCL2 release in LAD-2 cells after stimulation with BAM8-22 (5 µM, 18 h) was determined by ELISA. Data from 4 independent experiments performed in triplicates were compiled and expressed as the mean ± S.E.M. Asterisks indicate a significant difference to not stimulated cells.
Figure 8
Figure 8. MRGPR-X1-induced signaling in DRG neurons and CTMCs.
A cartoon illustrating the signaling circuit by which MRGPR-X1 affect chemokine signaling in DRG neurons and connective tissue mast cells is given.

Similar articles

Cited by

References

    1. Lembo PM, Grazzini E, Groblewski T, O'Donnell D, Roy MO, et al. (2002) Proenkephalin A gene products activate a new family of sensory neuron – specific GPCRs. Nat Neurosci 5: 201–209. - PubMed
    1. Dong X, Han S, Zylka MJ, Simon MI, Anderson DJ (2001) A diverse family of GPCRs expressed in specific subsets of nociceptive sensory neurons. Cell 106: 619–632. - PubMed
    1. Tatemoto K, Nozaki Y, Tsuda R, Konno S, Tomura K, et al. (2006) Immunoglobulin E-independent activation of mast cell is mediated by Mrg receptors. Biochem Biophys Res Commun 349: 1322–1328. - PubMed
    1. Subramanian H, Kashem SW, Collington SJ, Qu H, Lambris JD, et al. (2011) PMX-53 as a dual CD88 antagonist and an agonist for Mas-related gene 2 (MrgX2) in human mast cells. Mol Pharmacol 79: 1005–1013. - PMC - PubMed
    1. Breit A, Gagnidze K, Devi LA, Lagace M, Bouvier M (2006) Simultaneous activation of the delta opioid receptor (deltaOR)/sensory neuron-specific receptor-4 (SNSR-4) hetero-oligomer by the mixed bivalent agonist bovine adrenal medulla peptide 22 activates SNSR-4 but inhibits deltaOR signaling. Mol Pharmacol 70: 686–696. - PubMed

Publication types

MeSH terms