. 2013;8(3):e59169.
doi: 10.1371/journal.pone.0059169. Epub 2013 Mar 11.

Determinants of human cyclin B1 association with mitotic chromosomes

Affiliations

Determinants of human cyclin B1 association with mitotic chromosomes

Kathleen L Pfaff et al. PLoS One. 2013.

Abstract

Cyclin B1-CDK1 activity is essential for mitotic entry, but questions remain regarding how the activity of this kinase is spatially regulated. Previous studies showed that the cyclin B1 subunit localizes to several compartments of a mitotic cell, including the centrosomes, mitotic spindle, kinetochores and chromosomes via distinct sequence elements. Mitotic chromosome association occurs through the unstructured N-terminal domain of cyclin B1 and is independent of CDK1 binding. Here, we use live cell imaging of human cyclin B1 fused to GFP to precisely define the sequence elements within cyclin B1 that mediate its association with condensed mitotic chromosomes. We find that a short, evolutionarily conserved N-terminal motif is required for cyclin B1 to localize to mitotic chromosomes. We further reveal a role for arginine residues within and near the destruction box sequence in the chromosome association of cyclin B1. Additionally, our data suggest that sequences further downstream in cyclin B1, such as the cytoplasmic retention sequence and the cyclin box, may negatively modulate chromosome association. Because multiple basic residues are required for cyclin B1 association with mitotic chromosomes, electrostatic interactions with DNA may facilitate cyclin B1 localization to chromosomes.


Conflict of interest statement

Competing Interests: The authors have declared that no competing interests exist.

Figures

Figure 1
Figure 1. Biochemical fractionation of HeLa cells demonstrates that cyclin B1 and CDK1 associate with mitotic chromosomes.
A. Endogenous cyclin B1 and CDK1 associate with a chromosome-enriched fraction. Hypotonic lysis of asynchronous (A) or mitotic HeLa cells produced whole cell extract (WCE), followed by fractionation of the mitotic lysate into chromosomal (CHR) and cytoplasmic fractions (CYTO). Western blotting was visualized with a Fuji LAS3000 Image Analyzer and quantified with the gel analysis package on ImageJ. The numbers below the CHR bands are the fraction of the total protein (CHR+CYTO) in the CHR fraction. α-Tubulin was used as a cytoplasmic control and indicated there was some contamination of cytoplasmic material in the chromosomal fraction. Histone H2B was used as the chromosomal control. B. Adenovirally expressed full length cyclin B1-GFP associates with mitotic chromosome-enriched fraction of HeLa cells. Experimental procedure and abbreviations as in part A. Cyclin B1-GFP was detected with the cyclin B1 antibody. C. GFP is not present in the chromosome-enriched fraction of mitotic HeLa cells that stably express GFP. Experimental procedure and abbreviations as in part A.
Figure 2
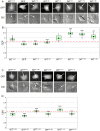
Figure 2. The first 20 amino acids of cyclin B1 can promote association with mitotic chromosomes.
A. Representative images of mitotic BS-C-1 cells expressing GFP fusions of WT1–433 cyclin B1, GFP only, or fragments of cyclin B1 that lack the C-terminus. The GFP signal is detected by the FITC channel (top) and the position of the metaphase plate (indicated with white arrows) can be identified with DIC optics (bottom). Scale bar  =  10 µm. B. Box-and-whisker plots of Chromosome Enrichment Ratios (CER) for the constructs shown in part A. The CER is calculated as the ratio of the mean fluorescence intensity of the chromosomal region to the mean fluorescence intensity of the entire cell. The diamond indicates the mean CER. The box represents the 2nd and 3rd quartiles of the data, with the horizontal line representing the median and the whiskers representing the range. The red dotted line indicates the threshold of 1.6 that correlates with chromosome association in the qualitative assay. N = 8–14, ** indicates p < 0.01 and *** indicates p<0.001 compared to WT1–433. Further details including mean CER, standard deviations, and Wilcoxon exact test p-values can be found in Table S2. C. Representative mitotic BS-C-1 cells expressing GFP fusions of cyclin B1 fragments that lack different regions of the N- and C-termini. The metaphase plate is indicated by white arrows. Scale bar = 10 µm. D CER plots for the constructs shown in part C. The red dotted line indicates the threshold of 1.6. N = 10–11, *** indicates p<0.001 compared to the WT1–433, WT1–166, WT1–110, respectively. Further details including mean CER, standard deviations, and Wilcoxon exact test p-values can be found in Table S2.
Figure 3
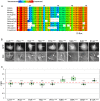
Figure 3. Identification of a novel chromosome localization motif in the N-terminus of cyclin B1.
A. Alignment of the cyclin B1 protein from a diversity of organisms reveals a region of high conservation within the first 10 amino acids. Degree of conservation for any given position is color-coded from blue (unconserved) to red (highly conserved), and is also indicated with a numerical score in the last row (Consistency). B. The Δ3–8 and many single amino acid substitutions in this region specifically disrupt the association of cyclin B1 with mitotic chromosomes. Representative images of mitotic BS-C-1 cells expressing mutated cyclin B1. White arrows indicate position of metaphase plate as seen in the DIC image. Scale bar = 10 µm. C. CER box-and-whisker plots for the constructs shown in part B. The red dotted line indicates the threshold of 1.6. N  = 8–10, *** indicates p<0.001 compared to WT1–433. Further details including mean CER, standard deviations, and Wilcoxon exact test p-values can be found in Table S2.
Figure 4
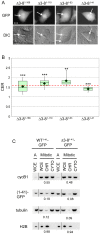
Figure 4. The Δ3–8 mutation causes defects in chromosome localization of N-terminal cyclin B1 fragments.
A. The Δ3–8 mutation disrupts the chromosome association of cyclin B1 truncations in a context-dependent fashion. Representative images of mitotic BS-C-1 cells expressing mutated cyclin B1. White arrows indicate position of metaphase plate as seen in the DIC image. Scale bar = 10 µm. B. CER box-and-whisker plots for the constructs shown in part A. The red dotted line indicates the threshold of 1.6. N  = 8–14, ** indicates p<0.01 and *** indicates p<0.001 compared to WT counterpart. Further details including mean CER, standard deviations, and Wilcoxon exact test p-values can be found in Table S2. C. Biochemical fractionation of HeLa cells stably expressing WT1–41-GFP or Δ3–81–41-GFP. (1–41)-GFP was detected with a cyclin B1 antibody. (Abbreviations as in Figure 1).
Figure 5
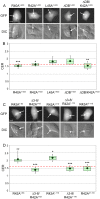
Figure 5. Arginine residues in and near the D-box are required for cyclin B1 localization to mitotic chromosomes.
A. Representative images of mitotic BS-C-1 cells expressing cyclin B1 containing mutations in and near the D-box. White arrows indicate the position of the metaphase plate as seen in the DIC image. Scale bar = 10 µm. B. CER box-and-whisker plots for the constructs shown in part A. The red dotted line indicates the threshold of 1.6. N  = 10–14, * indicates p<0.05, ** indicates p<0.01 and *** indicated p<0.001 compared to WT1–433. Further details including mean CER, standard deviations, and Wilcoxon exact test p-values can be found in Table S2. C. Representative images of mitotic BS-C-1 cells expressing cyclin B1 fragments bearing R42A or Δ3–8/R42A double mutations. White arrows indicate the position of the metaphase plate as seen in the DIC image. Scale bar = 10 µm. D. CER box-and-whisker plots for the constructs shown in part C. The red dotted line indicates the threshold of 1.6. N = 9–13, * indicates p<0.05, ** indicated p<0.01 and ***indicates p<0.001 compared to WT counterpart. Further details including mean CER, standard deviations, and Wilcoxon exact test p-values can be found in Table S2.
Figure 6
Figure 6. Model summarizing key findings.
A schematic representation of the Cyclin B1 protein. The numbers along the top indicate amino acid positions. D = D-box sequence, CRS = cytoplasmic retention sequence, * = MRAIL motif. This paper identifies amino acids 3–8 (LRVTRN) and arginine residues near the D-box as sequence motifs that promote cyclin B1 localization to chromosomes, whereas downstream regions, including the MRAIL motif, the CRS and the cyclin box may antagonize chromosome association.

Similar articles

Cited by

References

    1. Morgan DO (2007) The Cell Cycle: Principles of Control; Lawrence E, editor. Corby: Oxford University Press. 297 p.
    1. Lindqvist A, Rodriguez-Bravo V, Medema RH (2009) The decision to enter mitosis: feedback and redundancy in the mitotic entry network. J Cell Biol 185: 193–202. - PMC - PubMed
    1. Hartl P, Gottesfeld J, Forbes DJ (1993) Mitotic repression of transcription in vitro. J Cell Biol 120: 613–624. - PMC - PubMed
    1. Pyronnet S, Dostie J, Sonenberg N (2001) Suppression of cap-dependent translation in mitosis. Genes Dev 15: 2083–2093. - PMC - PubMed
    1. Nigg EA (2001) Mitotic kinases as regulators of cell division and its checkpoints. Nat Rev Mol Cell Biol 2: 21–32. - PubMed

Publication types

LinkOut - more resources