. 2013;7(3):e2046.
doi: 10.1371/journal.pntd.0002046. Epub 2013 Mar 7.

Rapid and scalable plant-based production of a cholera toxin B subunit variant to aid in mass vaccination against cholera outbreaks

Affiliations

Rapid and scalable plant-based production of a cholera toxin B subunit variant to aid in mass vaccination against cholera outbreaks

Krystal Teasley Hamorsky et al. PLoS Negl Trop Dis. 2013.

Abstract

Introduction: Cholera toxin B subunit (CTB) is a component of an internationally licensed oral cholera vaccine. The protein induces neutralizing antibodies against the holotoxin, the virulence factor responsible for severe diarrhea. A field clinical trial has suggested that the addition of CTB to killed whole-cell bacteria provides superior short-term protection to whole-cell-only vaccines; however, challenges in CTB biomanufacturing (i.e., cost and scale) hamper its implementation to mass vaccination in developing countries. To provide a potential solution to this issue, we developed a rapid, robust, and scalable CTB production system in plants.

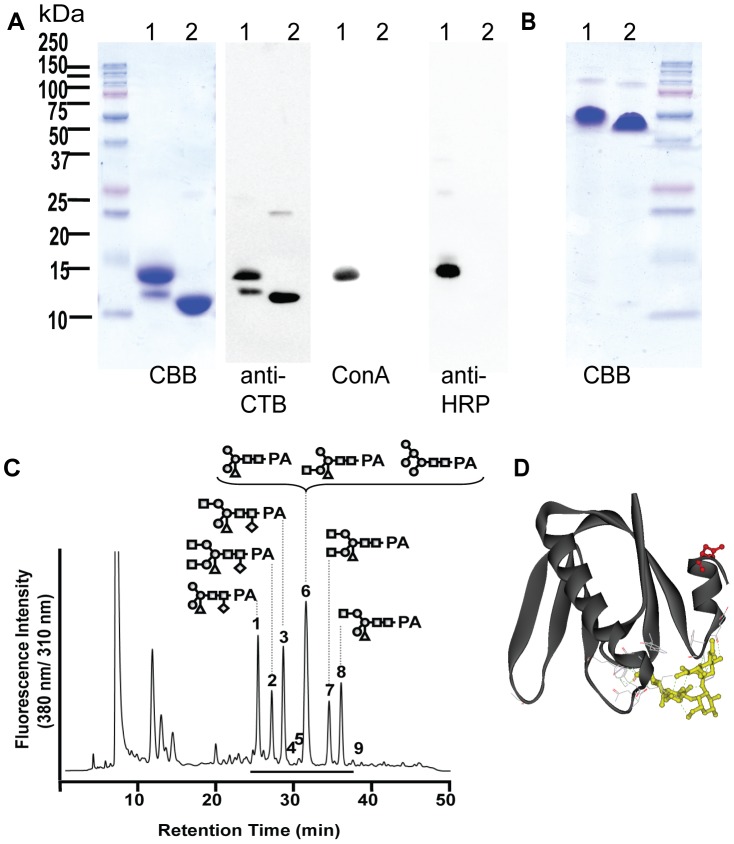
Methodology/principal findings: In a preliminary study of expressing original CTB in transgenic Nicotiana benthamiana, the protein was N-glycosylated with plant-specific glycans. Thus, an aglycosylated CTB variant (pCTB) was created and overexpressed via a plant virus vector. Upon additional transgene engineering for retention in the endoplasmic reticulum and optimization of a secretory signal, the yield of pCTB was dramatically improved, reaching >1 g per kg of fresh leaf material. The protein was efficiently purified by simple two-step chromatography. The GM1-ganglioside binding capacity and conformational stability of pCTB were virtually identical to the bacteria-derived original B subunit, as demonstrated in competitive enzyme-linked immunosorbent assay, surface plasmon resonance, and fluorescence-based thermal shift assay. Mammalian cell surface-binding was corroborated by immunofluorescence and flow cytometry. pCTB exhibited strong oral immunogenicity in mice, inducing significant levels of CTB-specific intestinal antibodies that persisted over 6 months. Moreover, these antibodies effectively neutralized the cholera holotoxin in vitro.

Conclusions/significance: Taken together, these results demonstrated that pCTB has robust producibility in Nicotiana plants and retains most, if not all, of major biological activities of the original protein. This rapid and easily scalable system may enable the implementation of pCTB to mass vaccination against outbreaks, thereby providing better protection of high-risk populations in developing countries.


Conflict of interest statement

I have read the journal's policy and have the following conflicts: KTH and NM have filed a patent application concerning the findings described in this paper (International Patent Application No. PCT/US12/29072).

Figures

Figure 1
Figure 1. Transgenic N. benthamiana-expressed CTB is N-glycosylated.
A, denaturing SDS-PAGE (Coomassie Brilliant Blue Stained, CBB) and an anti-CTB immunoblot showed that transgenic plant-expressed CTB has two monomer species, whereas the E. coli-produced counterpart has only one. The lectin concanavalin A (ConA) and anti-peroxidase antibodies (Anti-HRP) both bound to the upper band of the plant-expressed CTB, but not to the lower band or the eCTB, demonstrating the presence (in the upper band) and absence (lower band) of plant N-glycans in the plant-expressed B subunit (Lane 1 – CTB purified from transgenic Nicotiana benthamiana; 2 – eCTB) B, non-heat denaturing SDS-PAGE showed that transgenic Nicotiana-expressed CTB and the E. coli-made counterpart were assembled into homo-pentamers. The lane numbers are the same as in Fig. 1A . C, analysis of N-glycan structure showing the presence of plant-specific α(1, 3)-fucose/β(1,2)-xylose-containing glycans. The chromatogram shows RP-HPLC separation of 2-aminopyridine (PA)-labeled glycans isolated from Nicotiana-expressed CTB, with representative glycan structures depicted at corresponding PA-glycan fractions. A horizontal line represents the elution position for PA-labeled glycans. Symbols: circle (○), mannose; square (□), N-acetylglucosamine; diamond (◊), fucose; and triangle (Δ), xylose. D, a crystal structure image showing a CTB monomer complexed with GM1-ganglioside (side view; PBD ID: 3CHB). Dot lines in green represent hydrogen bonds involved in binding to GM1-ganglioside, which is shown in yellow. Asn4, which is glycosylated upon expression in eukaryotic cells, is highlighted in red. It is evident that the Asn4 side chain does not interact with GM1-ganglioside. Image was created in Accelrys Discovery Studio Visualizer 2.5.
Figure 2
Figure 2. Tobamoviral vector-based overexpression of the aglycosylated variant pCTB in N. benthamiana.
A, quantification of pCTB accumulation in leaf extracts with twelve different secretory signals. Lane 1- V. cholerae CTB; 2 - Rice-α amylase; 3 - N. plumbagenifolia calreticulin; 4 - Apple pectinase; 5 - Barley-α amylase; 6 - H. Vulgare chitinase; 7 - S. Tuberosum Glucan endo-1,3-beta-D-glucosidase; 8 - A. Thaliana Auxin-binding protein 1; 9 - P. Atrosepticum Pel B; 10 - P. vulgaris endopolygalacturonase-inhibiting protein; 11 - Tobacco PR1a; and 12 - Rice glutelin. GM1-ELISA was employed to quantify the amounts of receptor-binding pCTB. Data are expressed as mean ± SEM of experimental triplicate. The levels were normalized to an average accumulation level obtained with V. cholerae CTB signal peptide (0.016 g/kg). A representation of two separate experiments is shown. B, SDS-PAGE analysis of crude extracts of N. benthamiana leaves expressing pCTB with rice-α amylase signal peptide. Five days post vector inoculation (dpi), leaf proteins expressing pCTB were extracted with different pH buffers without or with 0.5 M sodium chloride salt (S). The arrow indicates the position of pCTB at ∼12 kDa. Control leaf extract are labeled NI. Extraction at pH 5 effectively removed ribulose-1,5-bisphosphate carboxylase oxygenase for simple and efficient pCTB purification based on chromatography. C, quantification of pCTB expressed with rice-α amylase signal peptide in leaf extracts (5 dpi). Data, expressed in gram of pCTB per kg of leaf material, were obtained by GM1-ELISA and plotted as mean ± SEM of three separate production runs. Column numbers 1–12 correspond to NI pH 2 with salt, pCTB pH 2 with salt, pCTB pH 3 with salt, pCTB pH 4 with salt, pCTB pH 5 with salt, pCTB pH 5, pCTB pH 6 with salt, pCTB pH 6, NI pH 7 with salt, pCTB pH 7 with salt, pCTB pH 7, pCTB pH 8 with salt, pCTB pH 8, respectively.
Figure 3
Figure 3. Purity of pCTB.
A, SDS-PAGE analysis. eCTB (lanes 1 and 3) and pCTB (lane 2 and 4) were purified by IMAC and a hydroxyapatite resin as described in Experimental Procedures. A total of 10 µg of purified protein was loaded in each well. Both CTB proteins appear as monomers under heat denaturing conditions (lanes 1 and 2), whereas mostly as pentamers with a trace amount of decamers under non-heat-denaturing conditions (lanes 3 and 4). B, SF-HPLC analysis of pCTB. The large peak corresponds to the CTB pentamer purified to >95% homogeneity. The minor peak is likely a decamer form (see text for details). C, MALDI-TOF-MS analysis of pCTB. The ions (peaks) in the spectrum of singly charged species ([M+H]+; magnified in the right panel) contain the mass-to-charge-ratios (m/z) of 12280.53, 12167.10, 12037.73, and 11923.19. These correspond well to the theoretical m/z values of full-length pCTB (12281.98), and variants lacking the C-terminal Leu (12168.78), Glu-Leu (12039.66), and Asp-Glu-Leu (11924.58), respectively.
Figure 4
Figure 4. Characterization of pCTB's GM1-ganglioside-binding activity.
A, binding affinity determination based on competitive GM1-ELISA using HRP-labeled CTB. The assay was performed in triplicate. The 50% inhibitory concentrations (IC50) of commercial, p-, and eCTB were determined by non-linear regression analysis (GraphPad Prism 5.0) to be 2.44, 2.85, and 4.51 nM, respectively. B, SPR. Each CTB protein was immobilized on a sensor chip via a CTB-specific monoclonal antibody, and varying concentrations of GM1-ganglioside were used as analytes. For each protein the assay was performed in triplicate. A representative sensorgram obtained with pCTB is shown. The colored curves represent the concentration of GM1-ganglioside (10, 3.33, 1.11, 0.37, and 0.123 µg/ml from top to bottom), and the black lines are the 1∶1 binding kinetics fit. C, analysis of pCTB's binding to RAW264.7 by immunofluorescence. After 48 h incubation, binding of (a) a PBS control, (b) commercial CTB, (c) pCTB, and (d) eCTB to the cells was detected by anti-CTB primary and Cy3-conjugated secondary antibodies on a Zeiss Observer.Z1 microscope (40×magnification) with the Axiovision AxioVs40 V4.6.30 software. The red signals correspond to the presence of CTB proteins. Nuclei were counterstained with DAPI. No significant difference was noted in cell-surface binding or cell morphology among the three proteins. Scale bar, 20 µm. D, a representative flow cytogram showing RAW264.7 cells bound by e- and pCTB, as detected by Cy3-conjugated secondary antibodies. PBS, eCTB, and pCTB histograms are blue, purple, and green, respectively, demonstrating the comparable binding of the bacterial and plant-made aglycosylated B subunits to the cells.
Figure 5
Figure 5. Thermal and pH stability analysis of pCTB.
A, the melting temperature (T m) determination using TSA. eCTB (dashed line) and pCTB (solid line) were analyzed in triplicate representing three individual lines per protein in the graph. T m of e- and pCTB were 75.5°C and 72.9°C, as determined by the vertex of the first derivative of the relative fluorescence unit (RFU) values. B, pH stability analysis by GM1-ELISA. e- and pCTB were diluted to 50 ng/ml in various pH buffers (see methods) and incubated for 5 min, and GM1-bound CTB proteins were quantified by GM1-ELISA. The results were normalized to the average value of the corresponding CTB protein at pH 7.4 and expressed as % binding. Data represent the mean ± SEM (n = 6) ns: values not significantly different at P>0.05 determined by unpaired Student t-test.
Figure 6
Figure 6. Oral immunogenicity of N. benthamiana-produced pCTB.
A and B, anti-CTB antibody titers. C57bl/6 mice were orally immunized with PBS, eCTB, or pCTB (10 or 30 µg) and again with the same antigens 2 weeks later. Endpoint titers of serum anti-CTB IgG (A) and fecal anti-CTB S-IgA (B) were analyzed 2 weeks after the second immunization. Horizontal bars show mean titers, whereas symbols represent titers of individual mice (for serum IgG) or triplicate analysis (for fecal IgA; fecal samples of each group were pooled for analysis). There was no significant difference between titers induced by the bacterial and plant-made aglycosylated B subunits (ANOVA with Bonferroni's multiple comparison test). C, representation of the percentage of anti-CTB IgA antibody secreting cells (ASCs) relative to the total IgA ASCs isolated from lamina propria, as determined by B-cell ELISPOT assay. Analysis was done 2 weeks after the second immunization. Data shown are mean ± SEM of triplicate analysis. No significant difference was found among e- and pCTB-immunized groups (ANOVA with Bonferroni's multiple comparison test). D, time-course assessment of CTB-specific IgA levels in fecal extracts. Fecal samples were collected 2 to 24 weeks after the second immunization from mice immunized with PBS, 30 µg eCTB, or 10 or 30 µg pCTB. Anti-CTB IgA levels induced by both bacterial and plant-made aglycosylated B subunits were sustained over 6 months. E, fecal anti-CTB IgA endpoint titers at termination (6 months after the second immunization). Horizontal bars show mean titers. Symbols represent titers of individual mice (fecal samples were not pooled). No significant difference was found among e- and pCTB-immunized groups (ANOVA with Bonferroni's multiple comparison test).
Figure 7
Figure 7. Inhibition of CT holotoxin's GM1-ganglioside binding by pCTB-induced antibodies.
A and B, relative amounts of GM1-bound holotoxin in the presence of (A) fecal and (B) serum Igs. CT holotoxin (100 ng/ml) was pre-incubated with undiluted fecal extracts (A) and 10× diluted sera (B) obtained from animals orally immunized with PBS, 30 µg eCTB, or 10 or 30 µg pCTB and analyzed in a GM1-ELISA. The results are shown as % of the average amount of CT detected with the PBS control group. Data shown are mean ± SEM of triplicate. Both fecal and serum Igs were prepared from animals 2 weeks after the second vaccination. For fecal Igs, all groups showed significant inhibition. For serum Igs, groups that were immunized with 30 µg pCTB and 30 µg eCTB showed significant inhibition: **P<0.01; ***P<0.001 (ANOVA with Bonferroni's multiple comparison test).
Figure 8
Figure 8. Neutralization of CT holotoxin by pCTB-induced antibodies in the CHO cell elongation assay.
A and B, quantitation of the CHO cell elongation by CT holotoxin pre-treatment with 10× diluted (A) fecal and (B) serum Ig samples. The holotoxin (20 ng/ml) was pre-incubated with 10× diluted fecal or serum samples obtained 2 weeks after the second vaccination from animals immunized with PBS, 10 or 30 µg pCTB, or 30 µg eCTB. Cell length was measured after overnight incubation and crystal violet staining. See Experimental Procedure for the detailed method. Data are shown as mean ± SEM of triplicate. For both fecal and serum Igs, all immunized groups showed significant neutralization of CT-induced cell elongation compared to the PBS control group: ***P<0.001 (ANOVA with Bonferroni's multiple comparison test). C, cells treated with CT. DG, cells treated with CT and fecal samples from animals immunized with 10 µg pCTB, 30 µg eCTB, 30 µg pCTB, and PBS, respectively. H, untreated control cells. IL, cells treated with CT and serum samples from animals immunized with 10 µg pCTB, 30 µg eCTB, 30 µg pCTB, and PBS, respectively. Scale bar, 100 µm.

Similar articles

Cited by

References

    1. Cholera, 2011. Wkly Epidemiol Rec 87: 289–304. - PubMed
    1. Clemens JD, Sack DA, Harris JR, Chakraborty J, Khan MR, et al. (1986) Field trial of oral cholera vaccines in Bangladesh. Lancet 2: 124–127. - PubMed
    1. Clemens JD, Harris JR, Sack DA, Chakraborty J, Ahmed F, et al. (1988) Field trial of oral cholera vaccines in Bangladesh: results of one year of follow-up. J Infect Dis 158: 60–69. - PubMed
    1. van Loon FP, Clemens JD, Chakraborty J, Rao MR, Kay BA, et al. (1996) Field trial of inactivated oral cholera vaccines in Bangladesh: results from 5 years of follow-up. Vaccine 14: 162–166. - PubMed
    1. Jertborn M, Svennerholm AM, Holmgren J (1992) Safety and immunogenicity of an oral recombinant cholera B subunit-whole cell vaccine in Swedish volunteers. Vaccine 10: 130–132. - PubMed

Publication types

MeSH terms