Evaluation of plasma D-dimer plus fibrinogen in predicting acute CVST
- PMID: 23506130
- PMCID: PMC4144996
- DOI: 10.1111/ijs.12034
Evaluation of plasma D-dimer plus fibrinogen in predicting acute CVST
Abstract
Background: Prompt diagnosis of cerebral venous sinus thrombosis is a challenge owing in part to its complex and non-specific early clinical symptoms.
Objective: This study aims to evaluate the value of clinically useful biomarkers (d-dimer and fibrinogen) for cerebral venous sinus thrombosis prediction.
Methods: Two-hundred and thirty-three suspected cerebral venous sinus thrombosis patients were enrolled in this prospective study. Thirty-four cases confirmed as cerebral venous sinus thrombosis using imaging modalities, whereas the other 199 cases served as mimic controls. Plasma samples of 34 healthy controls were further collected from age- and gender-matched volunteers. d-dimer and fibrinogen levels of all patients and controls were measured before imaging and treatment. The dynamic d-dimer and fibrinogen levels in cerebral venous sinus thrombosis cases after anticoagulation were monitored for up to 180 consecutive days.
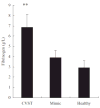
Results: At admission before treatment the average d-dimer and fibrinogen levels in cerebral venous sinus thrombosis group were 968·9 ± 160·1 μg/l and 6·9 ± 1·3 g/l, both of which were significantly elevated when compared with that of the controls. In cerebral venous sinus thrombosis patients, 94·1% had d-dimer elevation, 73·5% had fibrinogen elevation, and 67·6% had both elevated d-dimer and fibrinogen. During acute phase, the sensitivity and specificity of predicting cerebral venous sinus thrombosis using only d-dimer were 94·1% and 97·5%, whereas that of d-dimer in combination with fibrinogen were 67·6% and 98·9%. After administering anticoagulation, d-dimer levels gradually recovered; however, fibrinogen levels fluctuated with 33·3% of the patients still exhibiting elevated values up until 180 days.
Conclusions: d-dimer may serve as an important screening tool to determine the urgency of obtaining magnetic resonance imaging/magnetic resonance venography or digital subtraction angiography in patients presenting with clinical symptoms that are suspected of cerebral venous sinus thrombosis. Furthermore, d-dimer in combination with fibrinogen may increase the predictive value of acute cerebral venous sinus thrombosis.
Keywords: acute; cerebral venous sinus thrombosis; d-dimer; fibrinogen.
© 2013 The Authors. International Journal of Stroke © 2013 World Stroke Organization.
Figures


Similar articles
-
Clinical differences between acute CVST and non-thrombotic CVSS.Clin Neurol Neurosurg. 2012 Nov;114(9):1257-62. doi: 10.1016/j.clineuro.2012.03.036. Epub 2012 Jun 5. Clin Neurol Neurosurg. 2012. PMID: 22676956
-
D-dimer is useful in the diagnosis of cortical venous sinus thrombosis.Neurol India. 2009 Jan-Feb;57(1):50-4. doi: 10.4103/0028-3886.48822. Neurol India. 2009. PMID: 19305077
-
Endothelial receptor proteins in acute venous thrombosis and delayed thrombus resolution in cerebral sinus vein thrombosis.J Neurol. 2024 Jul;271(7):4095-4104. doi: 10.1007/s00415-024-12225-3. Epub 2024 Apr 5. J Neurol. 2024. PMID: 38578497 Free PMC article.
-
D-dimer testing in ischemic stroke and cerebral sinus and venous thrombosis.Semin Vasc Med. 2005 Nov;5(4):379-86. doi: 10.1055/s-2005-922484. Semin Vasc Med. 2005. PMID: 16302160 Review.
-
Cerebral Venous Sinus Thrombosis Associated With Coronavirus Disease 2019: Case Report and Review of the Literature.Neurologist. 2022 Sep 1;27(5):253-262. doi: 10.1097/NRL.0000000000000390. Neurologist. 2022. PMID: 34855659 Free PMC article. Review.
Cited by
-
Prognostic nutritional index predicts clinical outcomes in patients with cerebral venous sinus thrombosis.BMC Neurol. 2021 Oct 21;21(1):404. doi: 10.1186/s12883-021-02436-w. BMC Neurol. 2021. PMID: 34674659 Free PMC article.
-
D-dimer for the exclusion of cerebral venous thrombosis: a meta-analysis of low risk patients with isolated headache.BMC Neurol. 2015 Jul 28;15:118. doi: 10.1186/s12883-015-0389-y. BMC Neurol. 2015. PMID: 26215857 Free PMC article.
-
European Stroke Organization guideline for the diagnosis and treatment of cerebral venous thrombosis - Endorsed by the European Academy of Neurology.Eur Stroke J. 2017 Sep;2(3):195-221. doi: 10.1177/2396987317719364. Epub 2017 Jul 21. Eur Stroke J. 2017. PMID: 31008314 Free PMC article.
-
Venous stroke-a stroke subtype that should not be ignored.Front Neurol. 2022 Oct 6;13:1019671. doi: 10.3389/fneur.2022.1019671. eCollection 2022. Front Neurol. 2022. PMID: 36277910 Free PMC article. Review.
-
Prognostic value of systemic immune-inflammation index in acute/subacute patients with cerebral venous sinus thrombosis.Stroke Vasc Neurol. 2020 Dec;5(4):368-373. doi: 10.1136/svn-2020-000362. Epub 2020 Jun 24. Stroke Vasc Neurol. 2020. PMID: 32586971 Free PMC article.
References
-
- Fischer C, Goldstein J, Edlow J. Cerebral venous sinus thrombosis in the emergency department: retrospective analysis of 17 cases and review of the literature. J Emerg Med. 2010;38:140–7. - PubMed
-
- Beckham JC, Caldwell DS, Peterson BL, et al. Disease severity in rheumatoid arthritis: relationships of plasma tumor necrosis factor-alpha, soluble interleukin 2-receptor, soluble cd4/cd8 ratio, neopterin, and fibrin d-dimer to traditional severity and functional measures. J Clin Immunol. 1992;12:353–61. - PubMed
-
- Bentley JN, Figueroa RE, Vender JR. From presentation to follow-up: diagnosis and treatment of cerebral venous thrombosis. Neurosurg Focus. 2009;27:E4. - PubMed
-
- Arac A, Lee M, Steinberg GK, Marcellus M, Marks MP. Efficacy of endovascular stenting in dural venous sinus stenosis for the treatment of idiopathic intracranial hypertension. Neurosurg Focus. 2009;27:E14. - PubMed
-
- Klingebiel R, Bauknecht HC, Bohner G, Kirsch R, Berger J, Masuhr F. Comparative evaluation of 2D time-of-flight and 3D elliptic centric contrast-enhanced MR venography in patients with presumptive cerebral venous and sinus thrombosis. Eur J Neurol. 2007;14:139–43. - PubMed
Publication types
MeSH terms
Substances
Grants and funding
LinkOut - more resources
Full Text Sources
Other Literature Sources

