

Quantitative and qualitative differences in use and trends of hematopoietic stem cell transplantation: a Global Observational Study
- PMID: 23508009
- PMCID: PMC3729910
- DOI: 10.3324/haematol.2012.076349
Quantitative and qualitative differences in use and trends of hematopoietic stem cell transplantation: a Global Observational Study
Abstract
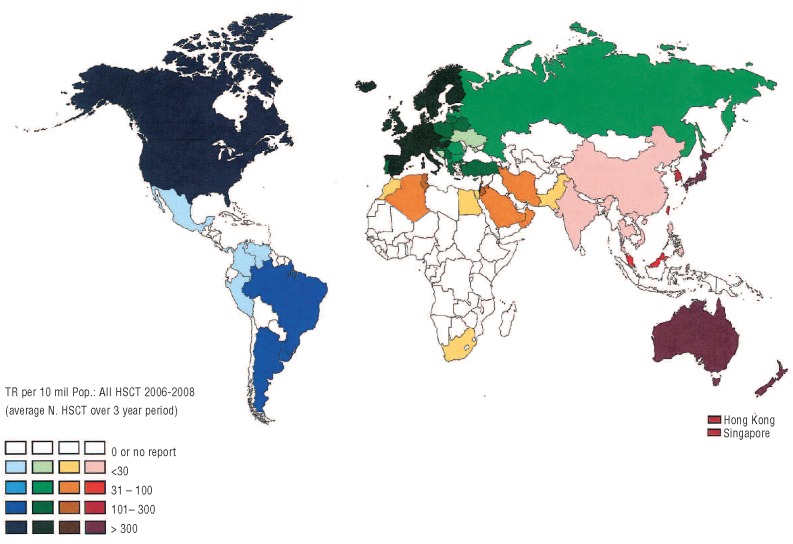
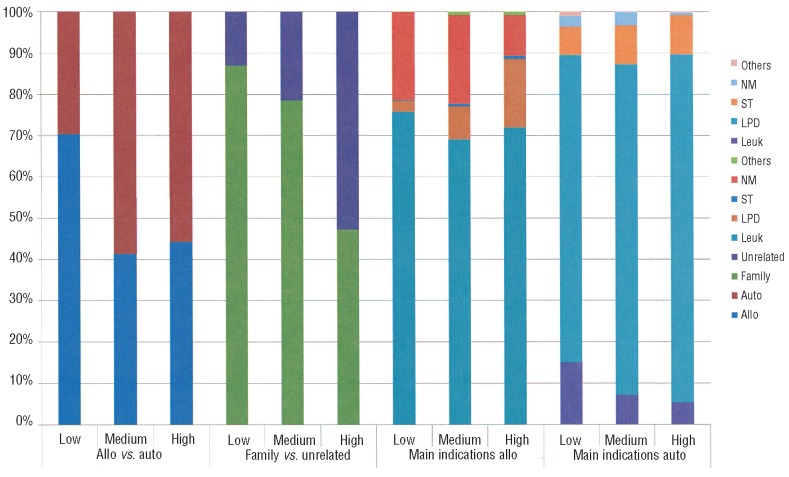
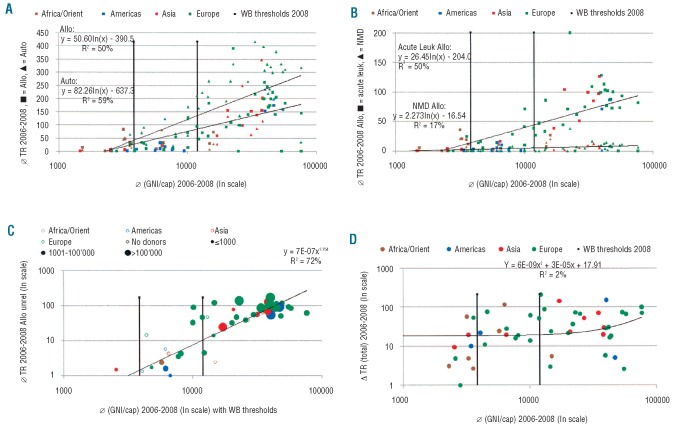
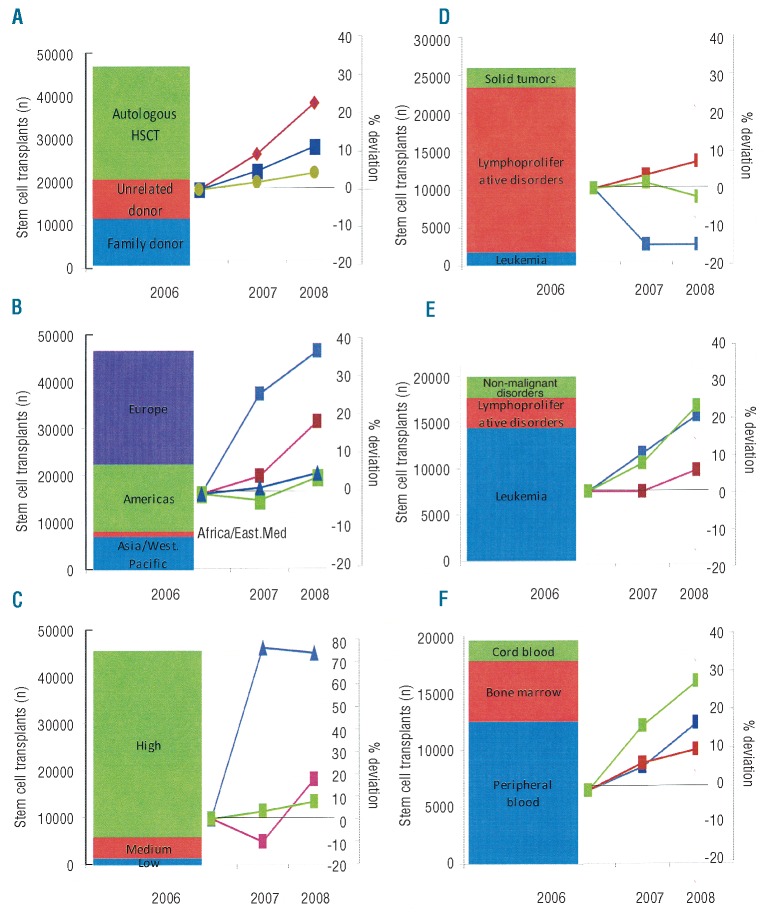
Fifty-five years after publication of the first hematopoietic stem cell transplantation this technique has become an accepted treatment option for defined hematologic and non-hematologic disorders. There is considerable interest in understanding differences in its use and trends on a global level and the macro-economic factors associated with these differences. Data on the numbers of hematopoietic stem cell transplants performed in the 3-year period 2006-2008 were obtained from Worldwide Network for Blood and Marrow Transplantation member registries and from transplant centers in countries without registries. Population and macro-economic data were collected from the World Bank and from the International Monetary Fund. Transplant rates were analyzed by indication, donor type, country, and World Health Organization regional offices areas and related to selected health care indicators using single and multiple linear regression analyses. Data from a total of 146,808 patients were reported by 1,411 teams from 72 countries over five continents. The annual number of transplants increased worldwide with the highest relative increase in the Asia Pacific region. Transplant rates increased preferentially in high income countries (P=0.02), not in low or medium income countries. Allogeneic transplants increased for myelodysplasia, chronic lymphocytic leukemia, acute leukemias, and non-malignant diseases but decreased for chronic myelogenous leukemia. Autologous transplants increased for autoimmune and lymphoproliferative diseases but decreased for leukemias and solid tumors. Transplant rates (P<0.01), donor type (P<0.01) aand disease indications (P<0.01) differed significantly between countries and regions. Transplant rates were associated with Gross National Income/capita (P<0.01) but showed a wide variation of explanatory content by donor type, disease indication and World Health Organization region. Hematopoietic stem cell transplantation activity is increasing worldwide. The preferential increase in high income countries, the widening gap between low and high income countries and the significant regional differences suggest that different strategies are required in individual countries to foster hematopoietic stem cell transplantation as an efficient and cost-effective treatment modality.
Figures
References
-
- Horowitz MM. Uses and growth of hematopoietic cell transplantation. In “Thomas’ hematopoietic cell transplantation” (Appelbaum FR, Forman SJ, Negrin RS, Blume KG, eds) p 15–21; 2009. Wiley-Blackwell, Oxford
-
- Gratwohl A, Passweg J, Baldomero H, Horisberger B, Urbano-Ispizua A; Accreditation Committee of the European Group for Blood and Marrow Transplantation (EBMT) Economics, health care systems and utilization of haematopoietic stem cell transplants in Europe. Br J Haematol. 2002;117(2):451–68 - PubMed
-
- Copelan EA. Hematopoietic stem-cell transplantation. N Engl J Med. 2006;354(17): 1813–26 - PubMed
-
- Appelbaum FR. Hematopoietic-cell transplantation at 50. N Engl J Med. 2007;357(15): 1472–5 - PubMed
Publication types
MeSH terms
Grants and funding
LinkOut - more resources
Full Text Sources
Other Literature Sources
Medical
Miscellaneous
