. 2013 Mar 18:7:74.
doi: 10.3389/fnhum.2013.00074. eCollection 2013.

A biased activation theory of the cognitive and attentional modulation of emotion

Affiliations

A biased activation theory of the cognitive and attentional modulation of emotion

Edmund T Rolls. Front Hum Neurosci. .

Abstract

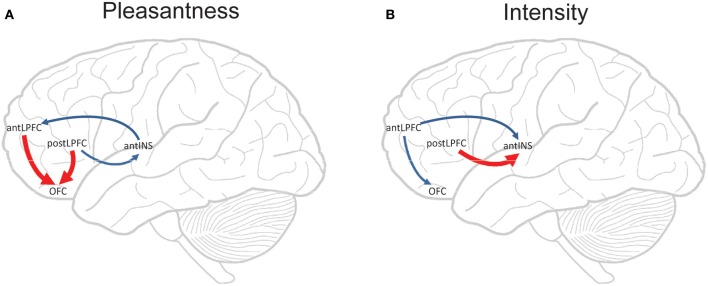
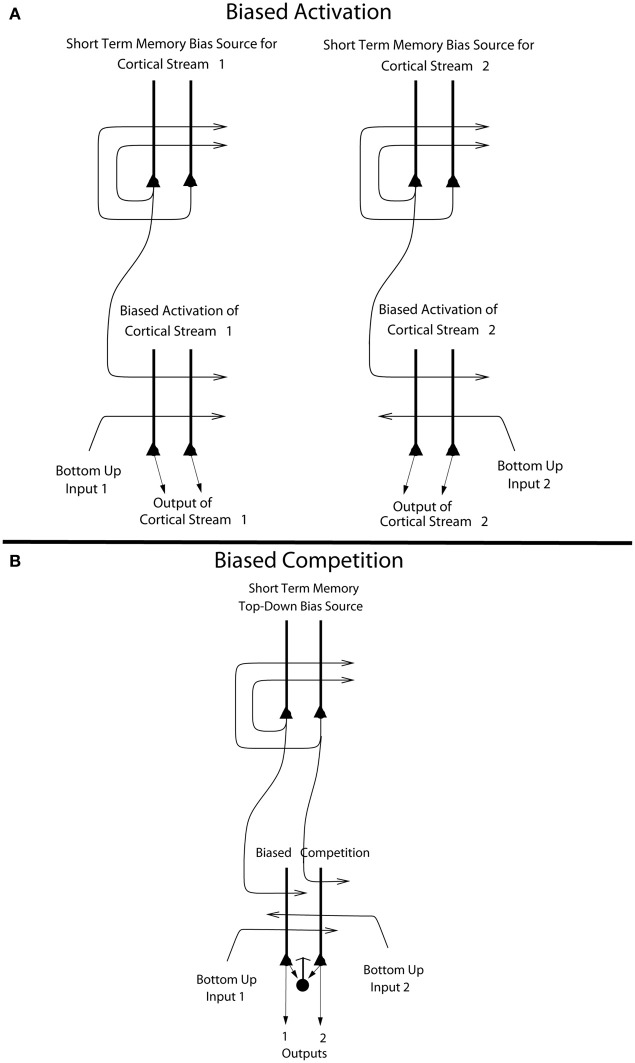
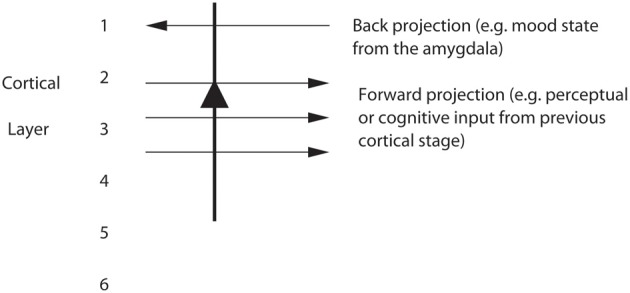
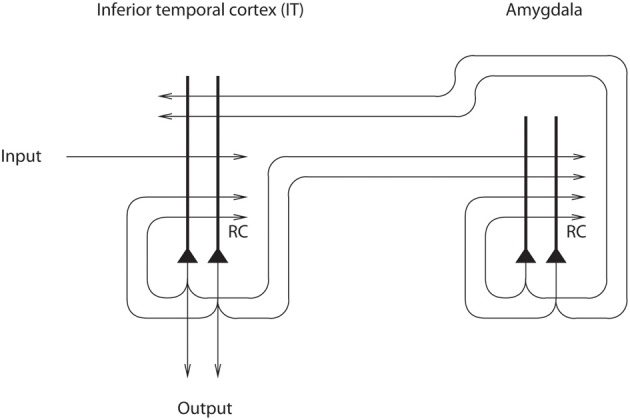
Cognition can influence emotion by biasing neural activity in the first cortical region in which the reward value and subjective pleasantness of stimuli is made explicit in the representation, the orbitofrontal cortex (OFC). The same effect occurs in a second cortical tier for emotion, the anterior cingulate cortex (ACC). Similar effects are found for selective attention, to for example the pleasantness vs. the intensity of stimuli, which modulates representations of reward value and affect in the orbitofrontal and anterior cingulate cortices. The mechanisms for the effects of cognition and attention on emotion are top-down biased competition and top-down biased activation. Affective and mood states can in turn influence memory and perception, by backprojected biasing influences. Emotion-related decision systems operate to choose between gene-specified rewards such as taste, touch, and beauty. Reasoning processes capable of planning ahead with multiple steps held in working memory in the explicit system can allow the gene-specified rewards not to be selected, or to be deferred. The stochastic, noisy, dynamics of decision-making systems in the brain may influence whether decisions are made by the selfish-gene-specified reward emotion system, or by the cognitive reasoning system that explicitly calculates reward values that are in the interests of the individual, the phenotype.

Keywords: cognition; decision-making; emotion; orbitofrontal cortex; planning; the noisy brain.


Figures

Figure 1
Figure 1
Some of the emotions associated with different reinforcement contingencies are indicated. Intensity increases away from the center of the diagram, on a continuous scale. The classification scheme created by the different reinforcement contingencies consists of (1) the presentation of a positive reinforcer (S+), (2) the presentation of a negative reinforcer (S−), (3) the omission of a positive reinforcer (S+) or the termination of a positive reinforcer (S+ !), and (4) the omission of a negative reinforcer (S−) or the termination of a negative reinforcer (S− !). It should be understood that each different reinforcer will produce different emotional states: this diagram just summarizes the types of emotion that may be elicited by different contingencies, but the actual emotions will be different for each reinforcer (see Rolls, 2014).
Figure 2
Figure 2
Organization of cortical processing for computing value (in Tier 2) and making value-based decisions (in Tier 3) and interfacing to action systems. The Tier 1 brain regions up to and including the column headed by the inferior temporal visual cortex compute and represent neuronally “what” stimulus/object is present, but not its reward or affective value. Tier 2 represents by its neuronal firing the reward or affective value, and includes the orbitofrontal cortex, amygdala, and anterior including pregenual cingulate cortex. Tier 3 is involved in choices based on reward value (in particular VMPFC area 10), and in different types of output to behavior. The secondary taste cortex, and the secondary olfactory cortex, are within the orbitofrontal cortex. V1—primary visual cortex. V4—visual cortical area V4. PreGen Cing—pregenual cingulate cortex. “Gate” refers to the finding that inputs such as the taste, smell, and sight of food in regions where reward value is represented only produce effects when an appetite for the stimulus (modulated for example by hunger) is present (Rolls, 2005). Lateral PFC: lateral prefrontal cortex, a source for top-down attentional and cognitive modulation of affective value (Grabenhorst and Rolls, 2010). This is a schematic diagram, and is based on primates including humans, as rodents appear not to have homologs of some of the areas shown, including the granular prefrontal cortex, which includes much of the orbitofrontal cortex (Wise, ; Passingham and Wise, 2012); and because rodents have a taste system that is connected differently, without the obligatory route to the cortex that is shown (Scott and Small, ; Rolls, 2013a, 2014).
Figure 3
Figure 3
Cognitive modulation of flavor reward processing in the brain. (A) The medial orbitofrontal cortex was more strongly activated when a flavor stimulus was labeled “rich and delicious flavor” (MSGVrich) than when it was labeled “boiled vegetable water” (MSGVbasic) ([−8 28 −20]). (The flavor stimulus, MSGV, was the taste 0.1 M MSG + 0.005 M inosine 5′monophosphate combined with a consonant 0.4% vegetable odor). (B) The timecourse of the BOLD signals for the two conditions. (C) The peak values of the BOLD signal (mean across subjects ± SEM) were significantly different (t = 3.06, df = 11, p = 0.01). (D) The BOLD signal in the medial orbitofrontal cortex was correlated with the subjective pleasantness ratings of taste and flavor, as shown by the SPM analysis, and as illustrated (mean across subjects ± SEM, r = 0.86, p < 0.001). [Reproduced with permission from Grabenhorst et al. (2008)].
Figure 4
Figure 4
Effect of paying attention to the pleasantness vs. the intensity of a taste stimulus. (A) Top: A significant difference related to the taste period was found in the taste insula at [42 18 −14], z = 2.42, p < 0.05 (indicated by the cursor) and in the mid insula at [40 −2 4], z = 3.03, p < 0.025. Middle: Taste insula. Right: The parameter estimates (mean ± SEM across subjects) for the activation at the specified coordinate for the conditions of paying attention to pleasantness or to intensity. The parameter estimates were significantly different for the taste insula t = 4.5, df = 10, p = 0.001. Left: The correlation between the intensity ratings and the activation (% BOLD change) at the specified coordinate (r = 0.91, df = 14, p << 0.001). Bottom: Mid insula. Right: The parameter estimates (mean ± SEM across subjects) for the activation at the specified coordinate for the conditions of paying attention to pleasantness or to intensity. The parameter estimates were significantly different for the mid insula t = 5.02, df = 10, p = 0.001. Left: The correlation between the intensity ratings and the activation (% BOLD change) at the specified coordinate (r = 0.89, df = 15, p << 0.001). The taste stimulus, monosodium glutamate, was identical on all trials. (B) Top: A significant difference related to the taste period was found in the medial orbitofrontal cortex at [−6 14 −20], z = 3.81, p < 0.003 (toward the back of the area of activation shown) and in the pregenual cingulate cortex at [−4 46 −8], z = 2.90, p < 0.04 (at the cursor). Middle: Medial orbitofrontal cortex. Right: The parameter estimates (mean ± SEM across subjects) for the activation at the specified coordinate for the conditions of paying attention to pleasantness or to intensity. The parameter estimates were significantly different for the orbitofrontal cortex t = 7.27, df = 11, p < 10−4. Left: The correlation between the pleasantness ratings and the activation (% BOLD change) at the specified coordinate (r = 0.94, df = 8, p << 0.001). Bottom: Pregenual cingulate cortex. Conventions as above. Right: The parameter estimates were significantly different for the pregenual cingulate cortex t = 8.70, df = 11, p < 10−5. Left: The correlation between the pleasantness ratings and the activation (% BOLD change) at the specified coordinate (r = 0.89, df = 8, p = 0.001). The taste stimulus, 0.1 M monosodium glutamate, was identical on all trials. [Reproduced with permission from Grabenhorst and Rolls (2008)].
Figure 5
Figure 5
Componential Granger causality analysis of top-down effects on taste processing from different lateral prefrontal cortex areas during attention to either the pleasantness (A) or to the intensity (B) of a taste. Significant causal influences from t-tests with a Bonferroni correction are marked by blue arrows (i.e., cross-componential Granger causality is greater than 0). Red arrows indicate where significant top-down effects exist in addition to significant causal influences (i.e., a significant cross-componential Granger causality that is different in the two directions). The areas are anterior (mean y ≈ 50) and posterior (mean y ≈ 37) lateral prefrontal cortex (antLPFC, postLPFC); orbitofrontal cortex secondary cortical taste area (OFC); and anterior insular cortex primary cortical taste area (antINS). [Reproduced with permission from Ge et al. (2012)].
Figure 6
Figure 6
(A) Biased activation. The short-term memory systems that provide the source of the top-down activations may be separate (as shown), or could be a single network with different attractor states for the different selective attention conditions. The top-down short-term memory systems hold what is being paid attention to active by continuing firing in an attractor state, and bias separately either cortical processing system 1, or cortical processing system 2. This weak top-down bias interacts with the bottom up input to the cortical stream and produces an increase of activity that can be supralinear (Deco and Rolls, 2005b). Thus the selective activation of separate cortical processing streams can occur. In the example, stream 1 might process the affective value of a stimulus, and stream 2 might process the intensity and physical properties of the stimulus. The outputs of these separate processing streams then must enter a competition system, which could be for example a cortical attractor decision-making network that makes choices between the two streams, with the choice biased by the activations in the separate streams (see text). (B) Biased competition. There is usually a single attractor network that can enter different attractor states to provide the source of the top-down bias (as shown). If it is a single network, there can be competition within the short-term memory attractor states, implemented through the local GABA inhibitory neurons. The top-down continuing firing of one of the attractor states then biases in a top-down process some of the neurons in a cortical area to respond more to one than the other of the bottom-up inputs, with competition implemented through the GABA inhibitory neurons (symbolized by a filled circle) which make feedback inhibitory connections onto the pyramidal cells (symbolized by a triangle) in the cortical area. The thick vertical lines above the pyramidal cells are the dendrites. The axons are shown with thin lines and the excitatory connections by arrow heads.
Figure 7
Figure 7
Pyramidal cells in, for example, layers 2 and 3 of the temporal lobe association cortex receive forward inputs from preceding cortical stages of processing, and also backprojections from the amygdala. It is suggested that the backprojections from the amygdala make modifiable synapses on the apical dendrites of cortical pyramidal cells during learning when amygdala neurons are active in relation to a mood state; and that the backprojections from the amygdala via these modified synapses allow mood state to influence later cognitive processing, for example by facilitating some perceptual representations.
Figure 8
Figure 8
Architecture used to investigate how mood can affect perception and memory. The IT module represents brain areas such as the inferior temporal cortex involved in perception and hippocampus-related cortical areas that have forward connections to regions such as the amygdala and orbitofrontal cortex involved in mood and emotion (after Rolls and Stringer, 2001).

Similar articles

Cited by

References

    1. Amaral D. G., Price J. L., Pitkanen A., Carmichael S. T. (1992). Anatomical organization of the primate amygdaloid complex, in The Amygdala, ed Aggleton J. P. (New York, NY: Wiley-Liss; ), 1–66
    1. Bar M. (2007). The proactive brain: using analogies and associations to generate predictions. Trends Cogn. Sci. 11, 280–289 10.1016/j.tics.2007.05.005 - DOI - PubMed
    1. Beck D. M., Kastner S. (2009). Top-down and bottom-up mechanisms in biasing competition in the human brain. Vision Res. 49, 1154–1165 10.1016/j.visres.2008.07.012 - DOI - PMC - PubMed
    1. Bengtsson S. L., Haynes J. D., Sakai K., Buckley M. J., Passingham R. E. (2009). The representation of abstract task rules in the human prefrontal cortex. Cereb. Cortex 19, 1929–1936 10.1093/cercor/bhn222 - DOI - PMC - PubMed
    1. Bressler S. L., Menon V. (2010). Large-scale brain networks in cognition: emerging methods and principles. Trends Cogn. Sci. 14, 277–290 10.1016/j.tics.2010.04.004 - DOI - PubMed

LinkOut - more resources