

Evaluation of inconsistency in networks of interventions
- PMID: 23508418
- PMCID: PMC5411010
- DOI: 10.1093/ije/dys222
Evaluation of inconsistency in networks of interventions
Erratum in
- Int J Epidemiol. 2013 Jun;42(3):919
Abstract
Background: The assumption of consistency, defined as agreement between direct and indirect sources of evidence, underlies the increasingly popular method of network meta-analysis. No evidence exists so far regarding the extent of inconsistency in full networks of interventions or the factors that control its statistical detection.
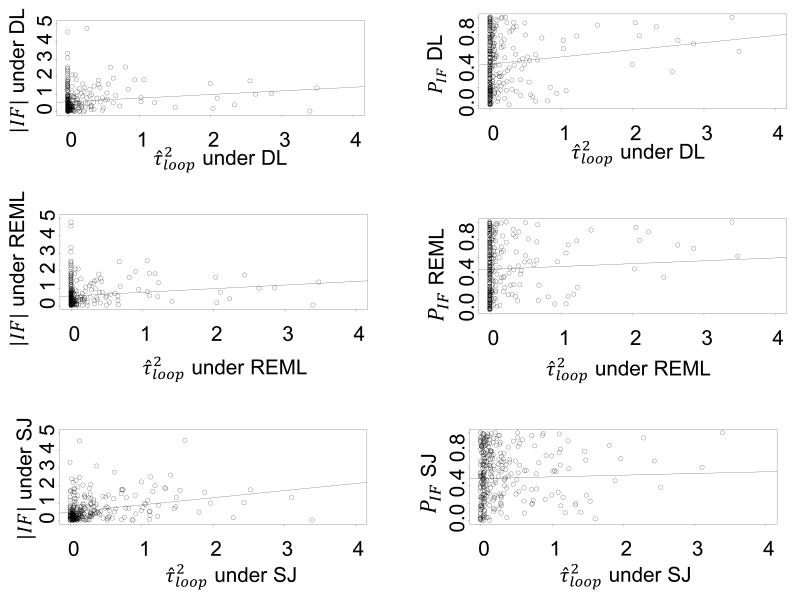
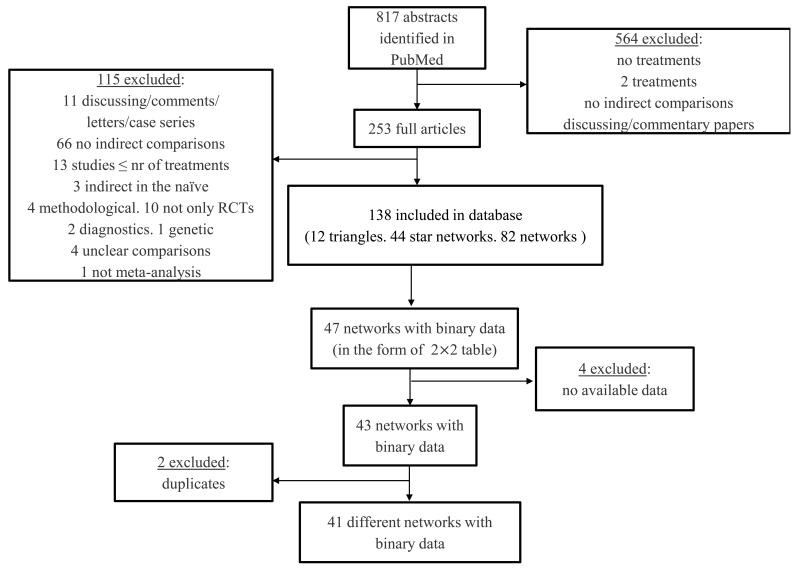
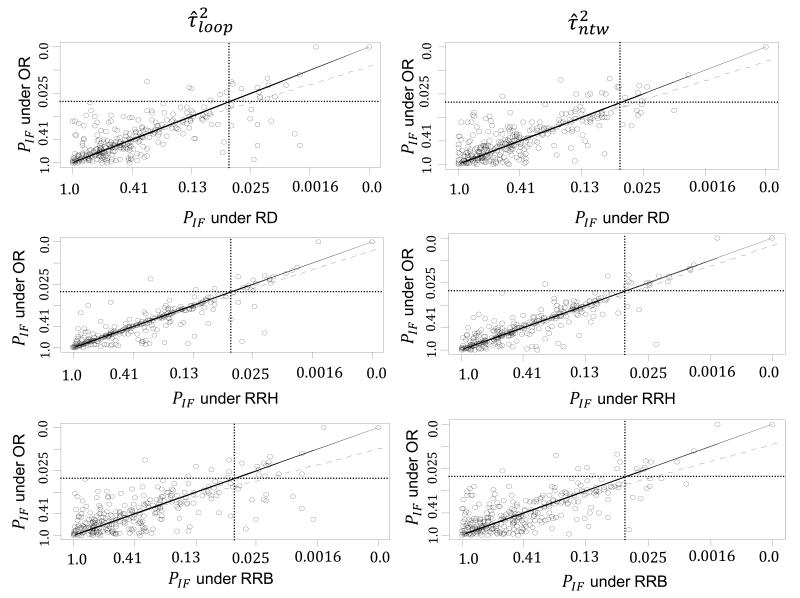
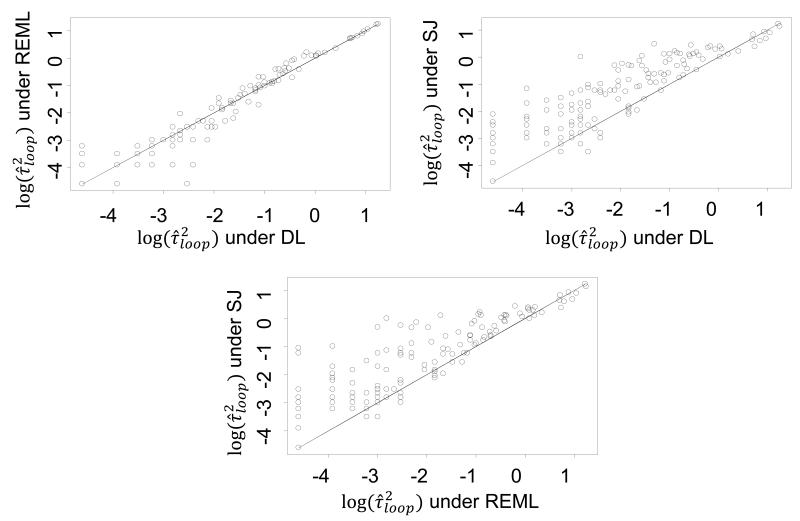
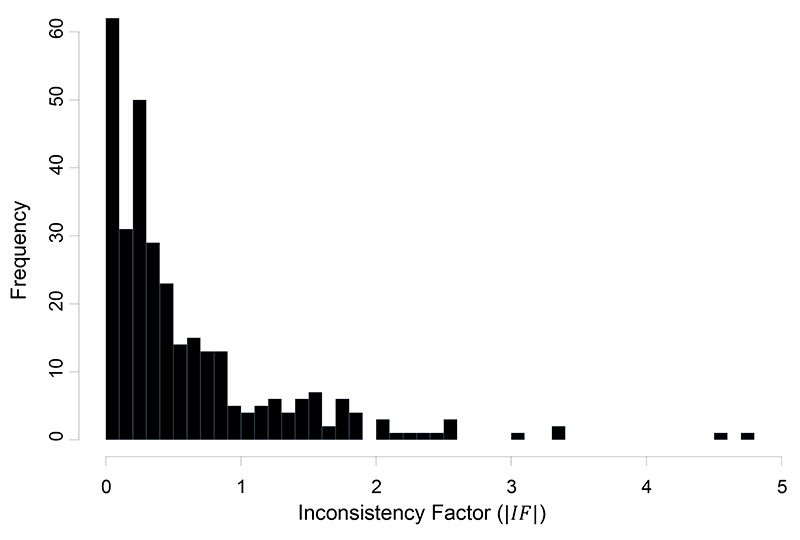
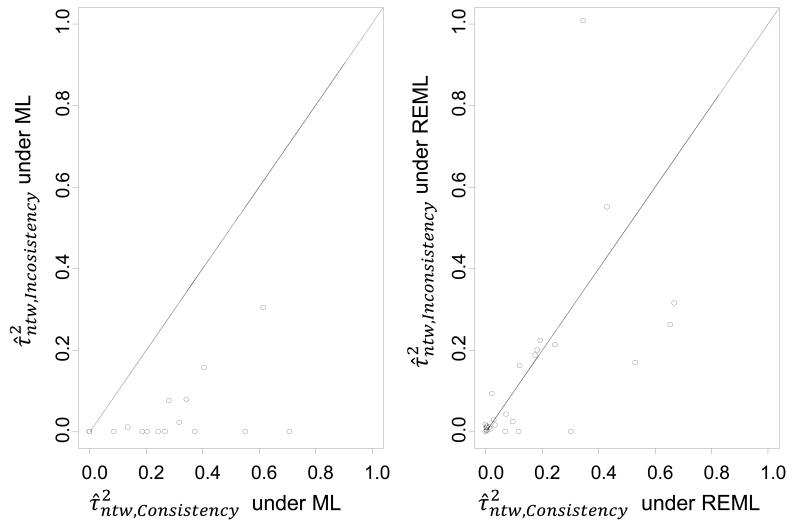
Methods: In this paper we assess the prevalence of inconsistency from data of 40 published networks of interventions involving 303 loops of evidence. Inconsistency is evaluated in each loop by contrasting direct and indirect estimates and by employing an omnibus test of consistency for the entire network. We explore whether different effect measures for dichotomous outcomes are associated with differences in inconsistency, and evaluate whether different ways to estimate heterogeneity affect the magnitude and detection of inconsistency.
Results: Inconsistency was detected in from 2% to 9% of the tested loops, depending on the effect measure and heterogeneity estimation method. Loops that included comparisons informed by a single study were more likely to show inconsistency. About one-eighth of the networks were found to be inconsistent. The proportions of inconsistent loops do not materially change when different effect measures are used. Important heterogeneity or the overestimation of heterogeneity was associated with a small decrease in the prevalence of statistical inconsistency.
Conclusions: The study suggests that changing the effect measure might improve statistical consistency, and that an analysis of sensitivity to the assumptions and an estimator of heterogeneity might be needed before reaching a conclusion about the absence of statistical inconsistency, particularly in networks with few studies.
Figures
References
5 Reference List
-
- Bucher HC, Guyatt GH, Griffith LE, Walter SD. The results of direct and indirect treatment comparisons in meta-analysis of randomized controlled trials. J Clin Epidemiol. 1997 Jun;50(6):683–91. - PubMed
-
- Higgins JP, Whitehead A. Borrowing strength from external trials in a meta-analysis. Stat Med. 1996;15(24):2733–49. - PubMed
-
- Lu G, Ades AE. Combination of direct and indirect evidence in mixed treatment comparisons. Stat Med. 2004;23(20):3105–24. - PubMed
-
- Coleman CI, Phung OJ, Cappelleri JC, et al. Use of Mixed Treatment Comparisons in Systematic Reviews [Internet] Appendix A, Verbatim Quotes From Guidance Documents. 2012 Available from: http://www.ncbi.nlm.nih.gov/books/NBK107337/ - PubMed
1 References to the included networks
-
- Ades AE, Mavranezouli I, Dias S, et al. Network meta-analysis with competing risk outcomes. Value Health. 2010;13:976–83. - PubMed
-
- Ara R, Pandor A, Stevens J, et al. Early high-dose lipid-lowering therapy to avoid cardiac events: a systematic review and economic evaluation. Health Technol Assess. 2009;13:1–118. - PubMed
-
- Baker WL, Baker EL, Coleman CI. Pharmacologic treatments for chronic obstructive pulmonary disease: a mixed-treatment comparison meta-analysis. Pharmacotherapy. 2009;29:891–905. - PubMed
-
- Ballesteros J. Orphan comparisons and indirect meta-analysis: a case study on antidepressant efficacy in dysthymia comparing tricyclic antidepressants, selective serotonin reuptake inhibitors, and monoamine oxidase inhibitors by using general linear models. J Clin Psychopharmacol. 2005;25:127–31. - PubMed
-
- Bangalore S, Kumar S, Kjeldsen SE, et al. Antihypertensive drugs and risk of cancer: network meta-analyses and trial sequential analyses of 324,168 participants from randomised trials. Lancet Oncol. 2011;12:65–82. - PubMed
Publication types
MeSH terms
Grants and funding
LinkOut - more resources
Full Text Sources
Other Literature Sources
