. 2013 Mar 18;200(6):757-72.
doi: 10.1083/jcb.201208163.

Pericentric chromatin loops function as a nonlinear spring in mitotic force balance

Affiliations

Pericentric chromatin loops function as a nonlinear spring in mitotic force balance

Andrew D Stephens et al. J Cell Biol. .

Abstract

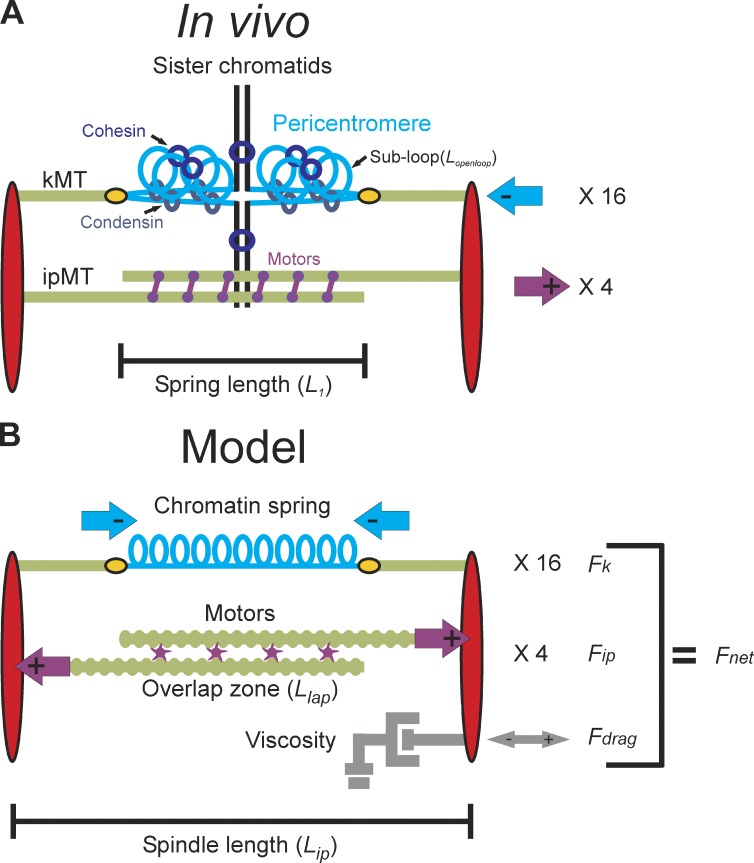
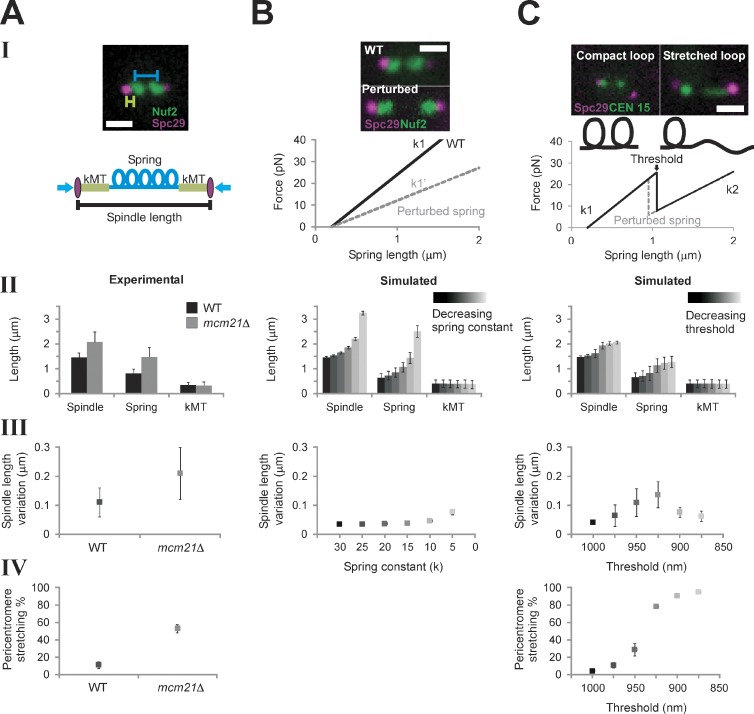
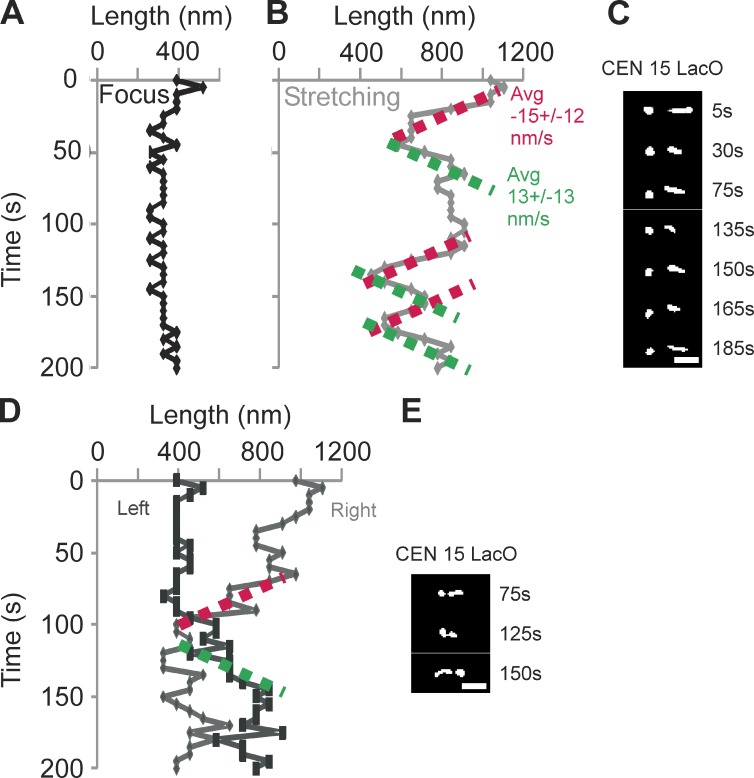
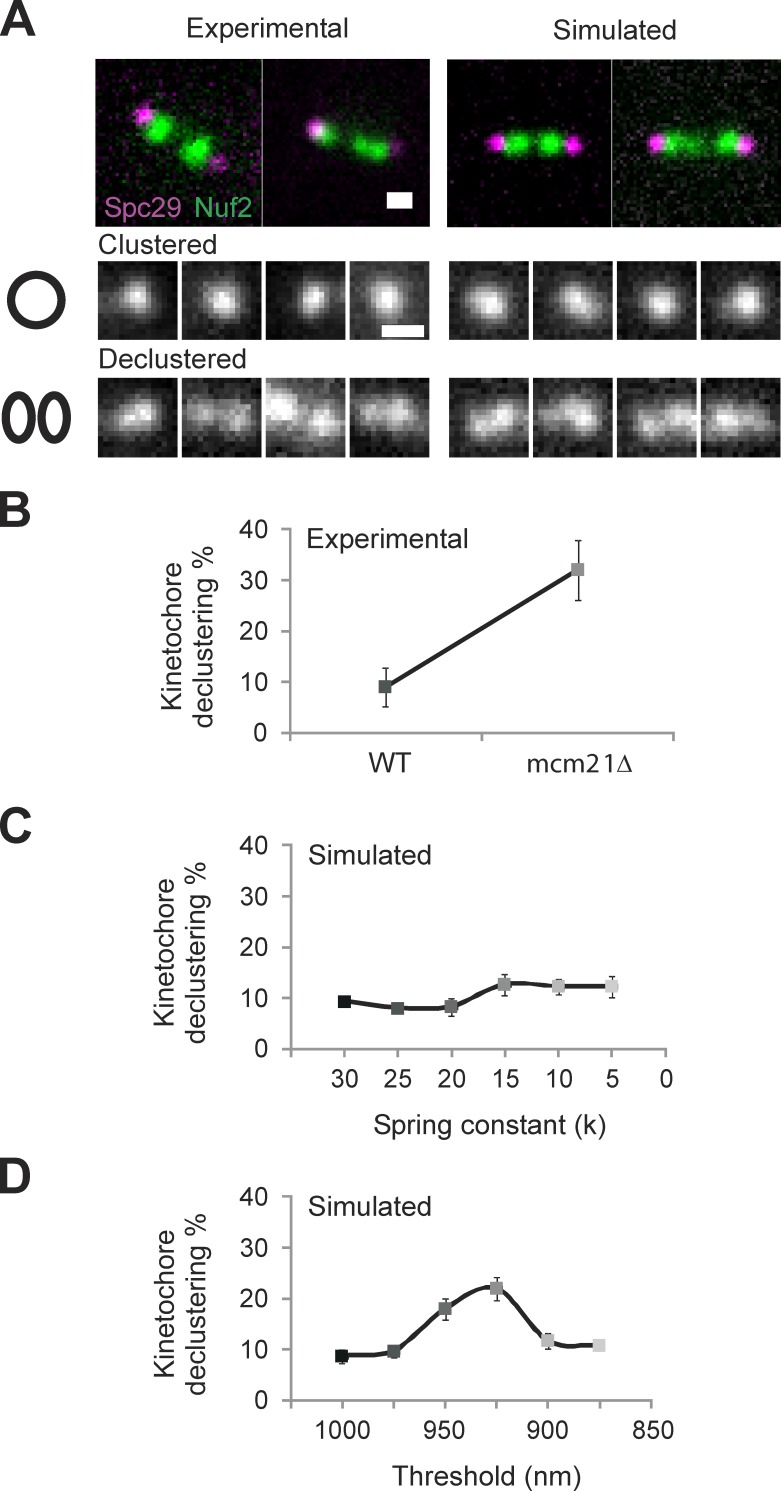
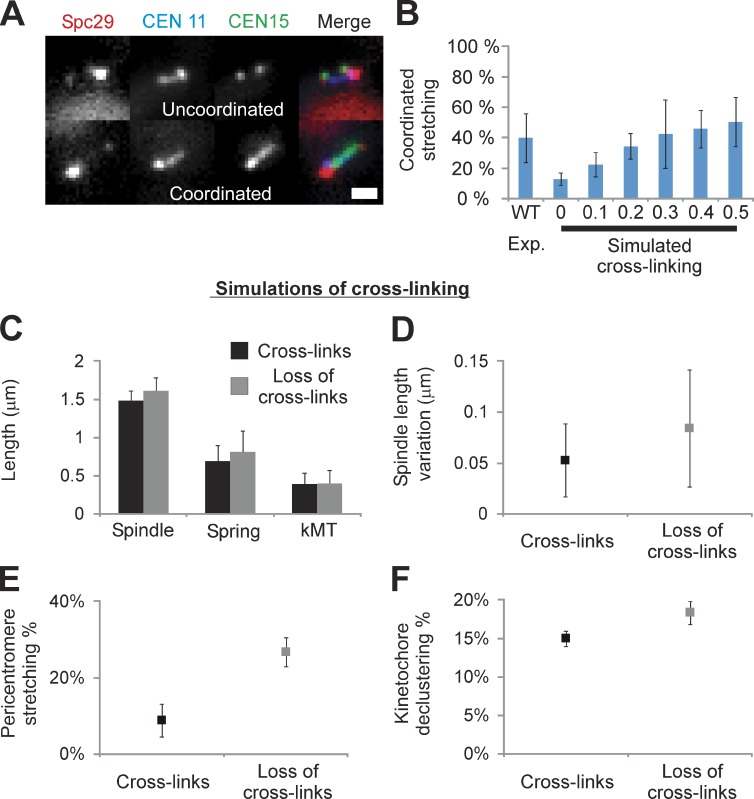
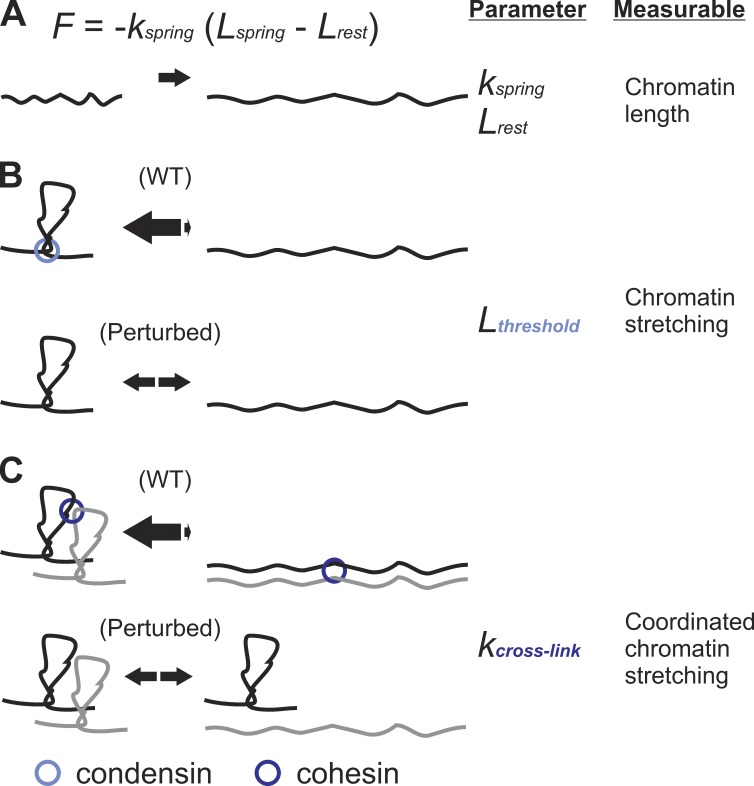
The mechanisms by which sister chromatids maintain biorientation on the metaphase spindle are critical to the fidelity of chromosome segregation. Active force interplay exists between predominantly extensional microtubule-based spindle forces and restoring forces from chromatin. These forces regulate tension at the kinetochore that silences the spindle assembly checkpoint to ensure faithful chromosome segregation. Depletion of pericentric cohesin or condensin has been shown to increase the mean and variance of spindle length, which have been attributed to a softening of the linear chromatin spring. Models of the spindle apparatus with linear chromatin springs that match spindle dynamics fail to predict the behavior of pericentromeric chromatin in wild-type and mutant spindles. We demonstrate that a nonlinear spring with a threshold extension to switch between spring states predicts asymmetric chromatin stretching observed in vivo. The addition of cross-links between adjacent springs recapitulates coordination between pericentromeres of neighboring chromosomes.


Figures

Figure 1.
Figure 1.
Structure of the yeast mitotic spindle. (A) Microtubules (kMTs, green) emanating from opposite spindle pole bodies (red) bind to the centromere via the kinetochore (yellow). Sister centromeres are spatially separated in metaphase and reside at the apex of a pericentric chromatin loop (in blue) that extends perpendicularly from the chromosome axis (black; Yeh et al., 2008). The total contour length of the pericentric chromatin loop is split between an axial component (approximated by the distance between the two kinetochores, L1) and subloops (Lopenloop) that extend perpendicular to the spindle axis. Condensin is more proximal to the spindle axis than cohesin. Approximately eight ipMTs overlap (two shown) and are bound by kinesin 5 motor proteins (purple). Although only one replicated chromosome is depicted with two kMTs, there are 16 chromosomes (32 sister chromatids) in budding yeast and ∼32 kMTs. The 16 kinetochores from each pole are clustered in mitosis. The aggregate chromatin spring length is measured by the distance between the two clusters (L1). (B) The model is written as a coupled system of stochastic and deterministic differential equations in which the sum of the forces applied to one spindle pole body is used to numerically solve for velocity at each time step. Spindle length is defined experimentally as the distance between the spindle pole bodies (red) in metaphase (Lip). The pericentric chromatin functions as a spring (blue, Fk). Its length is the distance between two sister kMT plus ends (Lspring). Kinesin motors (purple) bind to and couple ipMTs at the overlap zone (Llap) and slide ipMTs apart, generating an outward extensional force, Fip. The viscous properties of the nucleus are represented as a dashpot and resist movement of the spindle pole bodies in either direction (gray, Fdrag).
Figure 2.
Figure 2.
Model simulations with a piecewise continuous spring recapitulate experimental observations. (A) Experimental data of WT and mcm21Δ cells (pericentromere depleted of cohesin). Spindle length (II) and pericentromere stretching (IV) were measured using population images of cells containing Spc29-RFP spindle poles and LacO at CEN15, respectively. Spindle length variation (III, fluctuation about the mean spindle length) was measured by tracking spindle poles over ∼10 min (Stephens et al., 2011). (B) Numerical simulations of spindle dynamics with a linear chromatin spring F = −k (LspringLrest), in which Lrest = 200 nm (lighter = decreasing spring constant). The spring constant (k) was decreased to simulate perturbation of the spring (see B, I). Experimental images display an increase in the interkinetochore distance (distance between kinetochore clusters, Nuf2) in cohesin/condensin mutants. Simulations using a Hookean spring do not generate asymmetric pericentromere stretching. (C) Simulations of spindle dynamics with the spring defined by a piecewise continuous equation dependent on a threshold (lighter = decreasing threshold). (top) Experimental images reveal two spring states (compact, stretched) of a pericentromere LacO array. Under a force threshold (Lthreshold) the spring is looped (k1 and Lrest1, compact), and above the threshold, a loop stretches, adding length to the spring, which decreases the spring constant and increases the rest length (k2 and Lrest2, stretched). When Lspring < Lthreshold, F = −k1 (LspringLrest). At LspringLthreshold, the spring constant is reduced from k1 to k2 (k2 = k1 (L1/L1 + Lopenloop)) and greater rest length (Lrest2 = Lrest1 + Lopenloop), giving F = −k2 (LspringLrest2), in which the mean experimental aggregate spring length is L1 = 800 nm and Lopenloop = 450 nm (10 kb of nucleosomal chromatin from the stretched loop). (B and C) Simulated population measurements for linear (B) and nonlinear (C) spring models (spindle length [II] and pericentromere stretching [IV]) were generated by running the model and randomly selecting one time step [n = 500, five groups, 100 simulations each]). Simulated time lapses (III) were run for 1,000 s, 50 s for equilibrating, and 950 s measured (n = 25). Bars, 1 µm. Error bars represent standard deviation.
Figure 3.
Figure 3.
Rate of pericentromere chromatin stretching and recompaction. Time-lapse microscopy of sister pericentric CEN15 LacO arrays in mcm21Δ cells. Images were taken every 5 s for 200 s. Images were deconvolved as described in the Materials and methods, to determine the length of a LacO array along the spindle axis. (A–C) A representative time lapse shows stretching (line) and compaction (foci) of the LacO array over time. (A) Change in length of the left sister LacO array as a function of time in a single cell. The left LacO array appears predominantly as a spot and is slightly larger than the diameter of a diffraction spot. (B) Length of the right sister LacO array as a function of time. To determine a mean compaction and stretching rate, we fit a linear slope to regions that displayed greater than three successive steps in one direction. The mean compaction and stretching rates are −15 ± 12 nm/s (n = 9) and 13 ± 13 nm/s (n = 9), respectively, for six cells. (C) Selective images from the time lapse of sister LacOs A and B. The time point is indicated to the right. (D) Example from a time lapse indicating that sister chromatid stretching can switch from side to side. The right LacO array condenses as the left LacO array commences stretching. (E) Selective images from D. The time point is indicated to the right. Bars, 1 µm.
Figure 4.
Figure 4.
Experimental kinetochore declustering is predicted by simulations with a piecewise continuous chromatin spring (CNLS) but not a linear spring (CLS). (A) Experimental and simulated images of WT and mcm21Δ cells with Spc29-RFP (spindle poles) and Nuf2 or Ndc80-GFP (kinetochores) were scored as clustered (kinetochore focus) or declustered in cells having the focus of 16 kinetochores split into multiple foci. Example experimental (left) and simulated (right) images showing a bundle of clustered (middle) and declustered (bottom). (B) Experimental declustering in WT and mcm21Δ cells (WT: 9 ± 4%, n = 209, two experiments; mcm21Δ: 32 ± 6%, n = 230, two experiments). (C and D) Model simulations were used to generate images that match the physical geometry of the mitotic spindle (model convolution; Quammen et al., 2008; Gardner et al., 2010). The position of the spindle poles and plus end of each kMT were convolved with the point-spread function of our microscope objective to produce a simulated image of spindle poles and clusters of kinetochore proteins at the microtubule plus ends. Declustering was scored using the same criteria as in experimental images (n = 300, three groups of 100). (C) Decreasing the linear spring constant by an order of magnitude results in an insignificant increase (9–12%, χ2 > 0.30) in kinetochore declustering. (D) Decreasing the threshold of a piecewise continuous spring results in a significant increase in declustering (10–22%, χ2 < 1 × 10⁻⁴) comparable to experimental (B vs. D). Bars, 0.5 µm. Error bars represent standard deviation.
Figure 5.
Figure 5.
Observed coordinated stretching is predicted in simulations with cross-links between adjacent chromatin springs. Cells were labeled with Spc29-RFP (spindle poles), TetO/TetR-CFP at 0.4 kb from CEN11, and LacO/LacI-GFP 1.8 kb from CEN15. WT cells exhibit stretching of a single pericentromere LacO in 11% of cells (Stephens et al., 2011) and recapitulated herein (12 ± 3%, n = 261). (A) Cells with two labeled arrays (CEN11 and CEN15) exhibit one stretching (uncoordinated, top) or both stretching (coordinated, bottom; WT: 40 ± 16%, n = 45 stretching cells). (B) Coordinated stretching was measured in simulations of a piecewise continuous spring, in which asymmetric stretching can be predicted (Fig. 2 C). Chromatin springs were cross-linked with a Hookean spring of increasing strength relative to the chromatin spring constant (0–0.5× = 0–15 pN vs. chromatin spring constant of 30 pN, n = 500, five experiments [Exp.] of 100). For each cross-linking spring constant, the threshold was altered to obtain 12 ± 2% stretching if a single pericentromere was labeled (experimental WT single stretching percentage). Population simulations were then measured for coordinated stretching of any pair of springs. In the absence of cross-linking (0, Simulated) the predicted frequency of coordinated stretching is 13 ± 4%, less than observed experimentally (left, WT). Cross-linking springs with 0.3× the spring constant of the chromatin spring best match experimental (P = 0.88, 42 ± 22%, right; vs. WT 40 ± 16%, left). (C–F) Loss of cross-linking (0 kcross-link; 955 nm Lthreshold) displays increased spindle length (C), spindle variation (D), pericentromere stretching (E), and kinetochore declustering (F; P < 0.05). Bar, 1 µm. Error bars represent standard deviation.
Figure 6.
Figure 6.
Testable parameters of a piecewise continuous spring. (A) The most common form of a spring is given by a Hookean spring equation F = −kspring (LspringLrest), in which k is the spring constant, and Lrest is the spring rest length. Simulations of a linear spring fail to account for behavior of the spindle and the pericentric chromatin upon experimental depletion of pericentric cohesin or condensin (see Table 1). (B) A nonlinear spring with a threshold length (Lthreshold) recapitulates increase in spindle length and fluctuations, asymmetric chromatin stretching, and kinetochore declustering. The threshold represents the length/force at which a compact loop transitions to a stretched loop. Cohesin and condensin increase the threshold of the chromatin loops maintaining compaction (equilibrium arrows shifted toward loops). Perturbation of the chromatin spring through depletion of pericentric cohesin or condensin decreases the length/force the loops can resist, causing the loops to stretch freely (equal amounts of compact and stretched loops; Fig. 2, A and C). The Lthreshold variable is an alternative way to modulate the native linear spring constant (k) and rest length (Lrest). (C) Experimentally observed stretching of two chromosomes could be simulated through the addition of a cross-linking spring between neighboring chromosomes (kcross-link; Fig. 5). Cross-linked chromatin springs can distribute tension, thereby increasing the ability of a single chromatin spring to resist reaching Lthreshold or extreme stretching (equilibrium arrows shifted toward the looped state). Simulation and experimental data suggest condensin and cohesin modulate Lthreshold and kcross-link, respectively.

References

    1. Akiyoshi B., Sarangapani K.K., Powers A.F., Nelson C.R., Reichow S.L., Arellano-Santoyo H., Gonen T., Ranish J.A., Asbury C.L., Biggins S. 2010. Tension directly stabilizes reconstituted kinetochore-microtubule attachments. Nature. 468:576–579 10.1038/nature09594 - DOI - PMC - PubMed
    1. Alushin G., Nogales E. 2011. Visualizing kinetochore architecture. Curr. Opin. Struct. Biol. 21:661–669 10.1016/j.sbi.2011.07.009 - DOI - PMC - PubMed
    1. Bachant J., Alcasabas A., Blat Y., Kleckner N., Elledge S.J. 2002. The SUMO-1 isopeptidase Smt4 is linked to centromeric cohesion through SUMO-1 modification of DNA topoisomerase II. Mol. Cell. 9:1169–1182 10.1016/S1097-2765(02)00543-9 - DOI - PubMed
    1. Batchelor G.K. 1967. An Introduction to Fluid Dynamics. Cambridge University Press, Cambridge, UK: 615 pp
    1. Birtwistle M.R., Rauch J., Kiyatkin A., Aksamitiene E., Dobrzyński M., Hoek J.B., Kolch W., Ogunnaike B.A., Kholodenko B.N. 2012. Emergence of bimodal cell population responses from the interplay between analog single-cell signaling and protein expression noise. BMC Syst. Biol. 6:109 10.1186/1752-0509-6-109 - DOI - PMC - PubMed

Publication types

MeSH terms

LinkOut - more resources