. 2013 Mar 18;200(6):839-50.
doi: 10.1083/jcb.201301120.

A novel single-cell screening platform reveals proteome plasticity during yeast stress responses

Affiliations

A novel single-cell screening platform reveals proteome plasticity during yeast stress responses

Michal Breker et al. J Cell Biol. .

Erratum in

  • J Cell Biol. 2013 Apr 15;201(2):353

Abstract

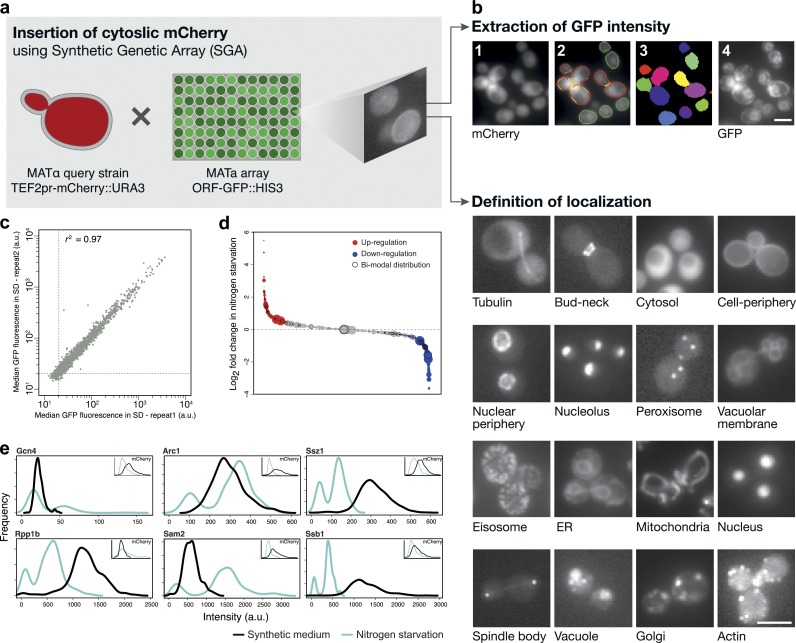
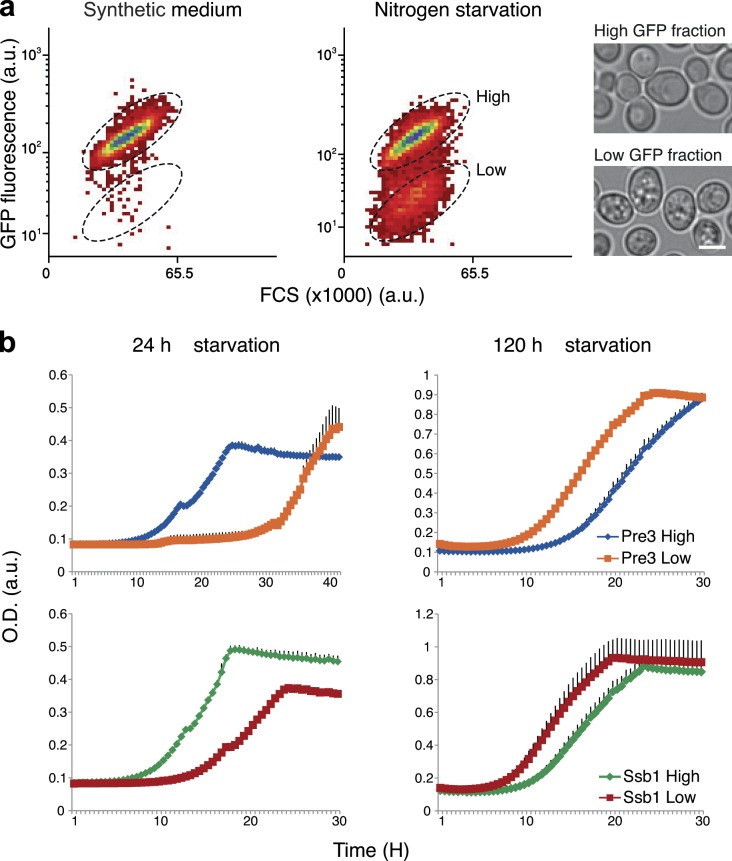
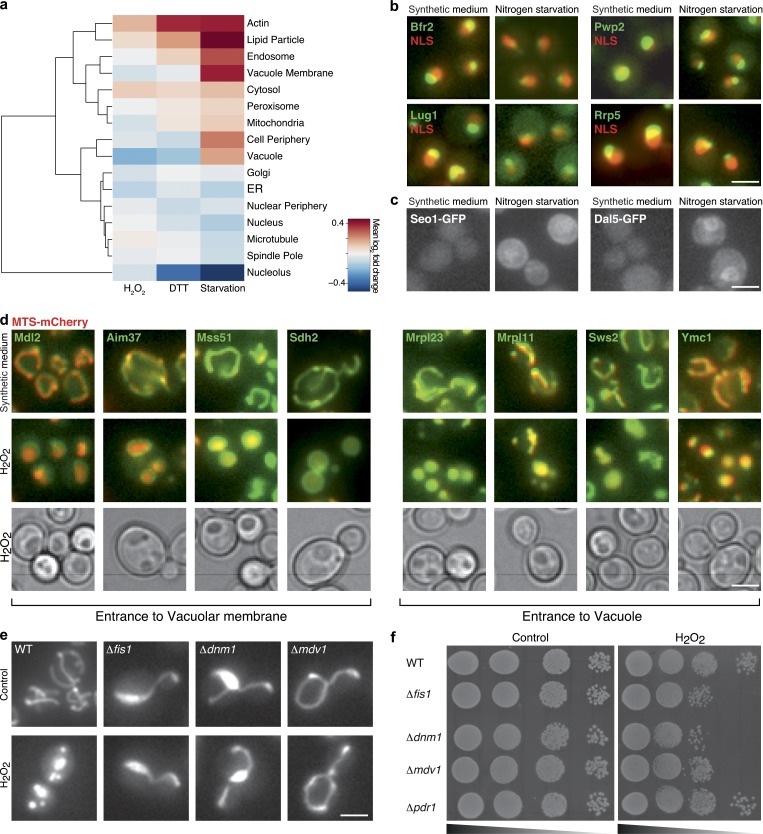
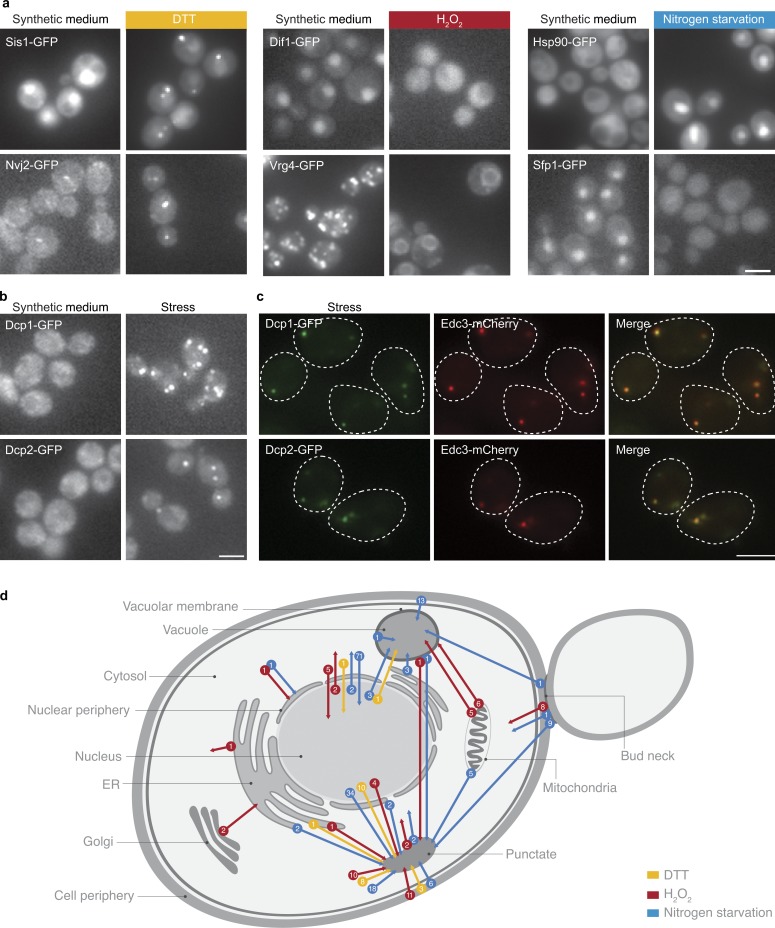
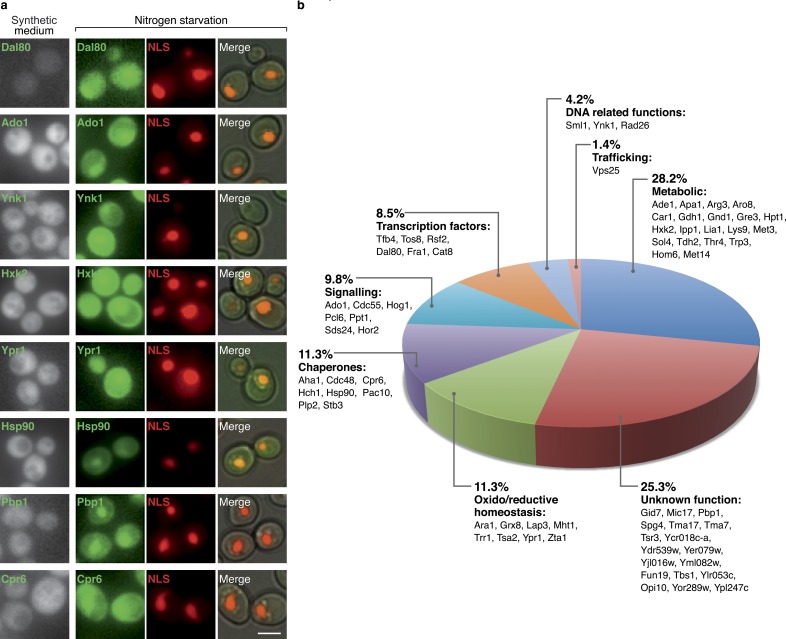
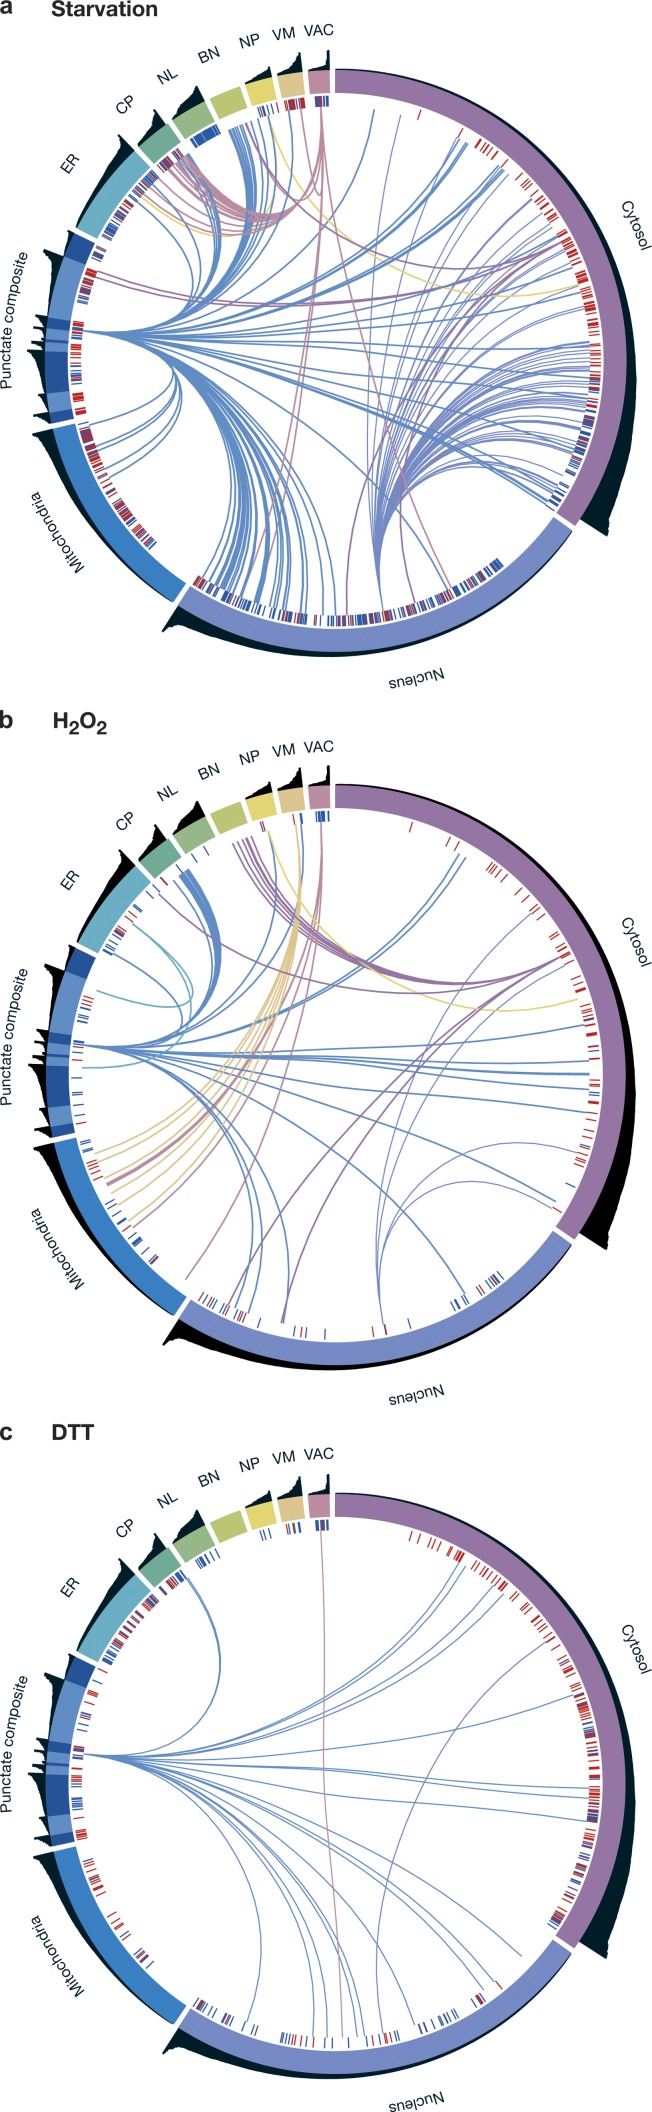
Uncovering the mechanisms underlying robust responses of cells to stress is crucial for our understanding of cellular physiology. Indeed, vast amounts of data have been collected on transcriptional responses in Saccharomyces cerevisiae. However, only a handful of pioneering studies describe the dynamics of proteins in response to external stimuli, despite the fact that regulation of protein levels and localization is an essential part of such responses. Here we characterized unprecedented proteome plasticity by systematically tracking the localization and abundance of 5,330 yeast proteins at single-cell resolution under three different stress conditions (DTT, H2O2, and nitrogen starvation) using the GFP-tagged yeast library. We uncovered a unique "fingerprint" of changes for each stress and elucidated a new response arsenal for adapting to radical environments. These include bet-hedging strategies, organelle rearrangement, and redistribution of protein localizations. All data are available for download through our online database, LOQATE (localization and quantitation atlas of yeast proteome).


Figures

Figure 1.
Figure 1.
Single-cell quantification of GFP-tagged protein levels reveals diverse proteomic changes during nitrogen starvation. (a) To track single cells, we integrated a cassette for expressing cytosolic mCherry into every strain of the yeast GFP collection. (b) We then automatically acquired images of hundreds of individual cells from each strain during growth in control conditions (logarithmic growth in SD) and three different stress stimuli. Using the mCherry (1), we segmented images (2) into single cell objects (3) and extracted GFP intensity in a single-cell resolution (4). Manual inspection of the library enabled the determination of subcellular localization for each protein (bottom). Bars, 5 µm. (c) A scatter plot (r2 = 0.97) of median fluorescence values measured for each of the 5,330 strains of the yeast GFP library in two independent experiments in SD (a.u., arbitrary units). (d) Bubble plot depicting relative abundance (in SD) indicated by the size of the circle and sorted by the log2 ratio of all measured strains under nitrogen starvation relative to SD. Red represents up-regulated events, blue represents down-regulated events, and black circles mark strains that were found to be significantly nonunimodal (i.e., to exhibit two subpopulations) by a Hartigan’s dip test. (e) Single-cell resolution analysis reveals bimodal distribution of expression of ribosome particles and ribosome-associated chaperones during nitrogen starvation relative to SD. Insets shows mCherry expression to remain unimodal in each strain under the same condition. This experiment was performed once on at least 100 cells per sample.
Figure 2.
Figure 2.
A bet-hedging strategy in yeast underlies prolonged survival under starvation. (a) Flow cytometry dot plots show the transition of unimodal distributed population of Pre3-GFP in SD (left) into two distinct subpopulations after 24 h of starvation (right; a.u., arbitrary units). High and low fractions (marked with broken ellipses on the right plot) were sorted accordingly. Microscopic analysis of the two sorted subpopulations demonstrates distinct morphologies. Bars, 5 µm. (b) Growth of the two subpopulations in SD immediately after sorting (24 h starvation, left) versus 4 d after sorting (120 h starvation, right) of both Pre3-GFP and Ssb1-GFP (OD). Each growth well contained 100,000 cells at the starting point. These measurements are the representative means of two repeats; error bars indicate standard deviation in black.
Figure 3.
Figure 3.
Integration of proteome abundance and subcellular organization enables characterization of the dynamics of organelle morphology and composition under stress. (a) Hierarchical clustering of mean log2 ratio of the change in abundance of proteins in each organelle under stress relative to SD. (b) Representative images of nucleolus proteins in SD or during growth in starvation medium. Colocalization with a nuclear mCherry (NLS) allows visualization of the massive shrinkage of this compartment relative to the nucleus under these conditions. (c) Representative images of cell periphery proteins that are expressed only under starvation and cause an increase in the protein levels in this organelle. (d) Representative images of mitochondrial proteins tagged with GFP coexpressed with a matrix-targeted dsRed (MTS-dsRed) during growth in SD or H2O2 treatment. During stress these proteins become localized to the vacuole lumen or membrane (as can be seen by the corresponding bright-field image) concomitantly with presence of the mitochondrial dsRed signal in the vacuole. (e) Mitochondrial fragmentation occurs when cells are exposed to medium containing 1 mM H2O2. This fragmentation is blocked in the absence of the fission machinery proteins Fis1, Dnm1, or Mdv1. (f) Fragmentation seems to be required for growth during oxidative stress as loss of fission capacity reduces fitness of cells under 1 mM H2O2 relative to control (YEPD). Bars, 5 µm.
Figure 4.
Figure 4.
Protein localization is dynamic under stress. (a) Two strains per condition (out of a total of 254 unique changes in protein localization) as examples for changes in predominant protein localization between growth in SD and growth under stress. (b) The only localization change that is common under all three stresses is proliferation of P-bodies. Shown are two P-body proteins, Dcp1 and Dcp2, changing localization from the cytosol to punctate foci. Broken lines represent the contour of the cell from bright-field images. (c) Foci of Dcp1 and Dcp2 colocalize with Edc3-mCherry during growth under every stress condition, which shows that these are bona fide P-bodies. (d) A schematic diagram depicting the types and numbers of changes in cellular localization observed during yeast growth in the three different stresses. Bars, 5 µm.
Figure 5.
Figure 5.
Examples of relocalizations of proteins from the cytosol into the nucleus during growth in nitrogen starvation medium. 71 cytosolic proteins categorized to eight different cellular functions could be visualized in the nucleus during starvation. (a) A representative protein from each of the categories is shown in SD and under nitrogen starvation, colocalized with a nuclear (NLS)-mCherry. Bars, 5 µm. (b) Pie chart with the relative size of each functional group and information on the genes categorized in it.
Figure 6.
Figure 6.
Integration of all proteomic changes gives a “thumbprint” of cellular stress responses. Representative schemes integrating all proteomic changes per each stress (a, starvation; b, H2O2; c, DTT) demonstrate the unique thumbprint of cell remodeling in each of the responses. The entire proteome is divided into organelles represented as colored segments on the circumference. The black bar plot above each organelle gives each protein’s abundance under SD and is sorted in each organelle. Blue (down-regulation) and red (up-regulation) bars demonstrate protein abundance changes. Lines between organelles demonstrate localization changes and are colored according to the destination organelle.

References

    1. Acar M., Mettetal J.T., van Oudenaarden A. 2008. Stochastic switching as a survival strategy in fluctuating environments. Nat. Genet. 40:471–475 10.1038/ng.110 - DOI - PubMed
    1. Allen C., Büttner S., Aragon A.D., Thomas J.A., Meirelles O., Jaetao J.E., Benn D., Ruby S.W., Veenhuis M., Madeo F., Werner-Washburne M. 2006. Isolation of quiescent and nonquiescent cells from yeast stationary-phase cultures. J. Cell Biol. 174:89–100 10.1083/jcb.200604072 - DOI - PMC - PubMed
    1. Aragón T., van Anken E., Pincus D., Serafimova I.M., Korennykh A.V., Rubio C.A., Walter P. 2009. Messenger RNA targeting to endoplasmic reticulum stress signalling sites. Nature. 457:736–740 10.1038/nature07641 - DOI - PMC - PubMed
    1. Balaban N.Q. 2011. Persistence: mechanisms for triggering and enhancing phenotypic variability. Curr. Opin. Genet. Dev. 21:768–775 10.1016/j.gde.2011.10.001 - DOI - PubMed
    1. Becskei A., Kaufmann B.B., van Oudenaarden A. 2005. Contributions of low molecule number and chromosomal positioning to stochastic gene expression. Nat. Genet. 37:937–944 10.1038/ng1616 - DOI - PubMed

Publication types

MeSH terms