. 2013 Jun;81(6):1889-904.
doi: 10.1128/IAI.00027-13. Epub 2013 Mar 18.

Plasmodium coatneyi in rhesus macaques replicates the multisystemic dysfunction of severe malaria in humans

Affiliations

Plasmodium coatneyi in rhesus macaques replicates the multisystemic dysfunction of severe malaria in humans

Alberto Moreno et al. Infect Immun. 2013 Jun.

Abstract

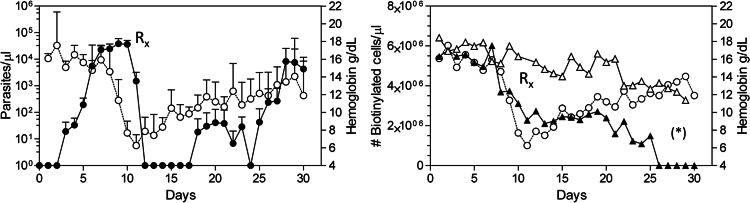
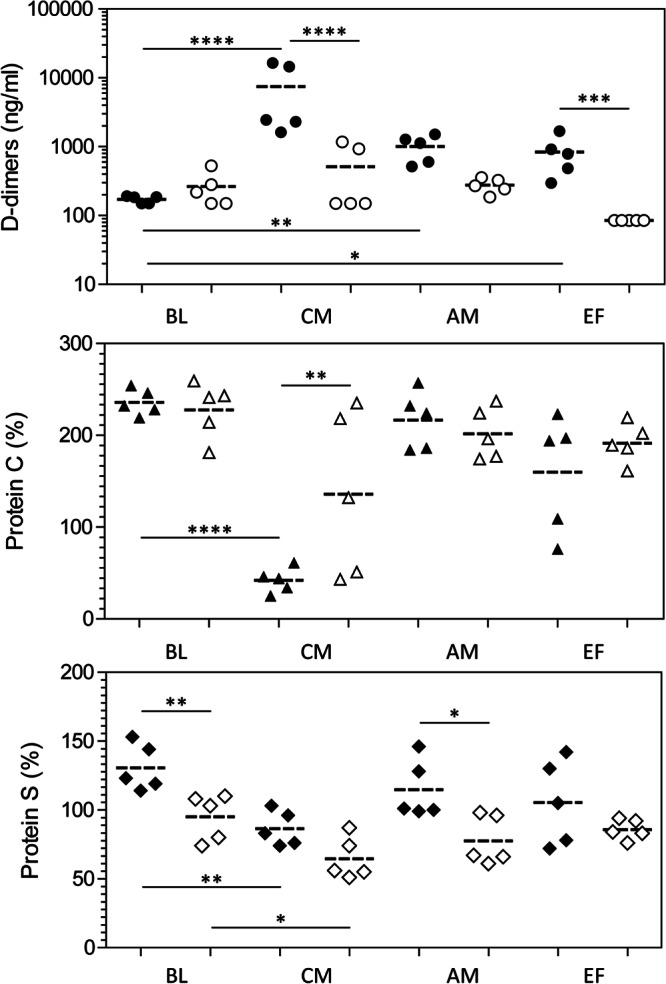
Severe malaria, a leading cause of mortality among children and nonimmune adults, is a multisystemic disorder characterized by complex clinical syndromes that are mechanistically poorly understood. The interplay of various parasite and host factors is critical in the pathophysiology of severe malaria. However, knowledge regarding the pathophysiological mechanisms and pathways leading to the multisystemic disorders of severe malaria in humans is limited. Here, we systematically investigate infections with Plasmodium coatneyi, a simian malaria parasite that closely mimics the biological characteristics of P. falciparum, and develop baseline data and protocols for studying erythrocyte turnover and severe malaria in greater depth. We show that rhesus macaques (Macaca mulatta) experimentally infected with P. coatneyi develop anemia, coagulopathy, and renal and metabolic dysfunction. The clinical course of acute infections required suppressive antimalaria chemotherapy, fluid support, and whole-blood transfusion, mimicking the standard of care for the management of severe malaria cases in humans. Subsequent infections in the same animals progressed with a mild illness in comparison, suggesting that immunity played a role in reducing the severity of the disease. Our results demonstrate that P. coatneyi infection in rhesus macaques can serve as a highly relevant model to investigate the physiological pathways and molecular mechanisms of malaria pathogenesis in naïve and immune individuals. Together with high-throughput postgenomic technologies, such investigations hold promise for the identification of new clinical interventions and adjunctive therapies.


Figures

Fig 1
Fig 1
P. coatneyi induces severe anemia in the absence of compensatory reticulocytosis. (Left) Course of parasitemia in rhesus macaques experimentally infected with P. coatneyi. The values are expressed as mean numbers of parasites/μl ± standard deviation (SD) determined using Giemsa-stained thick smears (left y axis) (●) and plotted with mean hemoglobin levels expressed in g/dl ± SD (right y axis) (○). (Right) Changes in reticulocyte counts expressed as mean absolute numbers/μl ± SD in rhesus macaques experimentally infected with P. coatneyi (♦); the hemoglobin levels are also plotted for comparison (○). Rx, subcurative treatment with artemether (n = 5).
Fig 2
Fig 2
Characterization of the erythrocyte life span in malaria-naïve rhesus macaques. The numbers of biotinylated cells were determined by flow cytometry and expressed as numbers of cells/μl, and the data are plotted for individual animals. Representative histogram plots are shown at different time points (5, 35, 72, 92, and 105 days) after in vivo biotinylation.
Fig 3
Fig 3
Accelerated turnover of noninfected erythrocytes during acute primary infections with P. coatneyi-nonimmune rhesus monkeys. (Left) Course of parasitemia (●) and hemoglobin levels (○) in malaria-naïve rhesus macaques as described for Fig. 1. (Right) Kinetics of circulating biotinylated cells in P. coatneyi-infected rhesus macaques (▲) in comparison with the kinetics of circulating biotinylated cells in noninfected monkeys (△). The results are presented as the mean numbers of biotinylated cells/μl determined by flow cytometry. Mean hemoglobin levels are also included for comparative purposes. *, P = 0.011. Differences were evaluated by comparing mean area under the curve (AUC) values using the Mann-Whitney test. Rx, subcurative treatment with artemether (n = 5).
Fig 4
Fig 4
P. coatneyi-semi-immune rhesus macaques are protected against severe anemia. (Left) Course of parasitemia in rhesus macaques exposed to a second infection with P. coatneyi. The parasite load values are compared with hemoglobin levels determined as described in the legend for Fig. 1. Parasitemia levels were determined using Giemsa-stained thick smears and are expressed as the mean numbers of parasites/μl ± SD (left y axis) (●). Hemoglobin levels are expressed as mean g/dl ± SD (right y axis) (○). (Right) Changes in reticulocyte counts in rhesus macaques exposed to a second infection with P. coatneyi (♦); the hemoglobin levels are also plotted for comparison (○). n = 5.
Fig 5
Fig 5
Turnover of noninfected erythrocytes during secondary infections with P. coatneyi in semi-immune rhesus monkeys. (Left) Course of parasitemia (●) and hemoglobin levels (○) in rhesus macaques during the second infection as described for Fig. 4. (Right) Kinetics of circulating biotinylated cells in P. coatneyi-infected rhesus macaques (♦) in comparison with the kinetics of circulating biotinylated cells in noninfected monkeys (◇). Mean hemoglobin levels are also included for comparative purposes. *, P = 0.01. For differences in the number of biotinylated cells during the first infection (summarized in the legend for Fig. 3) versus the second infection, P = 0.031. Differences were evaluated by comparing mean area under the curve (AUC) values using the Mann-Whitney test. n = 5.
Fig 6
Fig 6
Assessment of the clinical severity of rhesus macaques experimentally infected with P. coatneyi. Time course of the rhesus physiological scores system (RPSS) during the first (♦) or the second (●) infections. The results are compared with those recorded with the corresponding control groups (◇, ○, respectively). The results are presented as mean values ± standard errors of the means (SEM). **, P < 0.01 for infected versus control group in the course of the first or second infection; *, P = 0.016 for first infection versus second infection. Differences were evaluated by comparing mean area under the curve (AUC) values using the Mann-Whitney test.
Fig 7
Fig 7
Bone marrow core biopsy specimens of rhesus macaques experimentally infected with P. coatneyi. (A) Normocellular baseline bone marrow biopsy specimens obtained on day 0 showing a normal ratio of bone marrow cells to adipocytes (thick arrow) and a normal proportion of megakaryocytes (thin arrow). Bar, 100 μm. (B) Moderate to severe erythroid and myeloid hyperplasia with mild megakaryocyte hyperplasia of a representative core biopsy specimen obtained when severe clinical malaria was recorded. Bar, 100 μm. (C) Higher magnification of panel B showing pyknosis/karyorrhexis (arrows). Bar, 50 μm. (D) After antimalaria chemotherapy, nuclear changes were not observed. (E) Bone marrow hyperplasia of erythroid, myeloid, and megakaryocytic (arrows) lines in the course of the second infection. Bar, 200 μm. (F) Higher magnification showing efficient erythroid differentiation. Bar, 50 μm.
Fig 8
Fig 8
P. coatneyi induces multisystemic disorder in rhesus macaques. Time course of blood urea nitrogen (BUN), creatinine phosphokinase (CPK), triglycerides, and albumin levels in rhesus macaques exposed to the experimental infection. Data are from individual animals and group means (bars) at the following time points: BL, baseline (parasite inoculation); CM, clinical malaria (when RPSS clinical malaria was recorded); EF, end of the follow-up period. Closed symbols, first infection; open symbols, second infection. *, P < 0.05; **, P < 0.01; ***, P < 0.001, by one-way ANOVA with Bonferroni's multiple-comparison posttest.
Fig 9
Fig 9
Increased coagulation activity in P. coatneyi-infected rhesus macaques. Time course levels of D-dimers, protein C, and protein S in rhesus macaques exposed to the experimental infections. Data are from individual animals and group means (dotted bars) at the following time points: at baseline (BL), before parasite inoculation; at the time when RPSS clinical malaria (CM) was recorded; 7 days after the episode of severe malaria (AM); and at the end of the follow-up period (EF). Closed symbols, first infection; open symbols, second infection. ANOVA with Bonferroni's multiple-comparison posttest was used to compare changes after log transformation. *, P < 0.05; **, P < 0.01; ***, P < 0.001; ****, P < 0.0001.
Fig 10
Fig 10
P. coatneyi induces strong inflammatory immune response in malaria-naïve rhesus macaques. Individual patterns of plasma inflammatory mediators are compared in the course of the first (closed symbols) or second (open symbols) infections. (A) Samples obtained when high score values were detected using RPSS. (B) Samples obtained 7 days after the RPSS peaked. The results are expressed as fold increases of the corresponding mediator over baseline levels. Horizontal bars represent arithmetic mean values for each group. ANOVA with Bonferroni's multiple-comparison posttest was used to compare changes in baseline levels after log transformation. *, P < 0.05; **, P < 0.01; ***, P < 0.001; ****, P < 0.0001.
Fig 11
Fig 11
Ineffective erythropoiesis in P. coatneyi rhesus macaques is not dependent on abnormal EPO production. Time course levels of erythropoietin in plasma samples obtained from rhesus macaques in the course of the first infection (closed symbols) or second infection (opened symbols) determined by immunoassay. Data present levels for individual animals at baseline (BL), before parasite inoculation; at the time when RPSS clinical malaria (CM) was recorded; 7 days after the episode of severe malaria (AM); and at the end of the follow-up period (EF). Horizontal bars represent arithmetic mean values for each group. ANOVA with post hoc Bonferroni's multiple-comparison posttest was used to compare changes after log transformation. **, P < 0.01; ***, P < 0.001.

References

    1. WHO 2011. World malaria report 2011. World Health Organization, Geneva, Switzerland
    1. Snow RW, Guerra CA, Noor AM, Myint HY, Hay SI. 2005. The global distribution of clinical episodes of Plasmodium falciparum malaria. Nature 434:214–217 - PMC - PubMed
    1. Genton B, D'Acremont V, Rare L, Baea K, Reeder JC, Alpers MP, Muller I. 2008. Plasmodium vivax and mixed infections are associated with severe malaria in children: a prospective cohort study from Papua New Guinea. PLoS Med. 5:e127 doi:10.1371/journal.pmed.0050127 - DOI - PMC - PubMed
    1. Tjitra E, Anstey NM, Sugiarto P, Warikar N, Kenangalem E, Karyana M, Lampah DA, Price RN. 2008. Multidrug-resistant Plasmodium vivax associated with severe and fatal malaria: a prospective study in Papua, Indonesia. PLoS Med. 5:e128 doi:10.1371/journal.pmed.0050128 - DOI - PMC - PubMed
    1. WHO 2000. Severe falciparum malaria. Trans. R. Soc. Trop. Med. Hyg. 94(Suppl 1):1–90 - PubMed

Publication types

MeSH terms

LinkOut - more resources