Comparative Study
. 2013 Apr 2;110(14):E1321-9.
doi: 10.1073/pnas.1215680110. Epub 2013 Mar 18.

Dedicated olfactory neurons mediating attraction behavior to ammonia and amines in Drosophila

Affiliations
Comparative Study

Dedicated olfactory neurons mediating attraction behavior to ammonia and amines in Drosophila

Soohong Min et al. Proc Natl Acad Sci U S A. .

Abstract

Animals across various phyla exhibit odor-evoked innate attraction behavior that is developmentally programmed. The mechanism underlying such behavior remains unclear because the odorants that elicit robust attraction responses and the neuronal circuits that mediate this behavior have not been identified. Here, we describe a functionally segregated population of olfactory sensory neurons (OSNs) and projection neurons (PNs) in Drosophila melanogaster that are highly specific to ammonia and amines, which act as potent attractants. The OSNs express IR92a, a member of the chemosensory ionotropic receptor (IR) family and project to a pair of glomeruli in the antennal lobe, termed VM1. In vivo calcium-imaging experiments showed that the OSNs and PNs innervating VM1 were activated by ammonia and amines but not by nonamine odorants. Flies in which the IR92a(+) neurons or IR92a gene was inactivated had impaired amine-evoked physiological and behavioral responses. Tracing neuronal pathways to higher brain centers showed that VM1-PN axonal projections within the lateral horn are topographically segregated from those of V-PN and DC4-PN, which mediate innate avoidance behavior to carbon dioxide and acidity, respectively, suggesting that these sensory stimuli of opposing valence are represented in spatially distinct neuroanatomic loci within the lateral horn. These experiments identified the neurons and their cognate receptor for amine detection, and mapped amine attractive olfactory inputs to higher brain centers. This labeled-line mode of amine coding appears to be hardwired to attraction behavior.


Conflict of interest statement

The authors declare no conflict of interest.

Figures
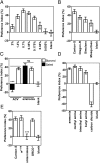
Fig. 1.
Fig. 1.
Insects exhibit innate attraction to ammonia and amines. (A) Attraction responses of wild-type (Canton-S) flies to different concentrations of ammonia in a T-maze. n = 4–12. (B) Attraction responses of another Drosophila strain (Oregon-R), a different species (Drosophila simulans), and mosquitoes (Anopheles stephensi) to ammonia. Ammonia concentrations of 0.7% and 0.005% were used for flies and mosquitoes, respectively. n = 5–10. (C) Behavioral responses of starved versus sated wild-type flies to apple cider vinegar (ACV) and ammonia. n = 7–12. ***P < 0.0001; ns: no significant difference by t test. (D) Behavioral responses of wild-type flies to a variety of amines and 1% CO2 in a T-maze. n = 4–20. (E) Attraction responses to ammonia in antennae-amputated and ORCO mutant flies. n = 13–15. ***P < 0.0001 by ANOVA Tukey-test. Error bars indicate SEM. In all figures, “blank” refers to responses of flies given a choice between two blank tubes.
Fig. 2.
Fig. 2.
IR92a+ neurons are activated specifically by ammonia and amines. (A) Behavioral responses of flies carrying IR8a-GAL4 alone, IR8a-GAL4 and UAS-TNT, or IR8a-GAL4 and UAS-impTNT to ammonia, trimethyl amine, and 1% CO2 in a T-maze. **P < 0.001, ***P < 0.0005 by ANOVA Tukey test; ns, no significant difference by t test. n = 11–48. Error bars indicate SEM. (B) In vivo calcium imaging of the AL from flies carrying OR35a-GAL4; UAS-GCaMP3 (Upper Row) or IR92a-GAL4; UAS-GCaMP3 (Lower Row). The images at the far left of each row are fluorescence micrographs of the glomeruli before odor stimulation. The other three images in each row show a map of peaked ∆F responses to the indicated odorants. A, anterior; M, medial. (Scale bars, 10 μm.) (C) Quantification of peaked ∆F responses of IR92a-GAL4; UAS-GCaMP3 flies to various odorants. Error bars indicate SEM. (n = 4–7).
Fig. 3.
Fig. 3.
IR92a+ neurons are required for attraction to ammonia and amines. (A) Attraction responses to ammonia in a T-maze in flies carrying Or35a-GAL4, IR92a-GAL4, or OR35a-GAL4 and IR92a-GAL4 driving either UAS-TNT or UAS-impTNT. n = 5–11. (B) Attraction responses to various amines in flies bearing IR92a-GAL4 driving either UAS-TNT or UAS-impTNT in a T-maze. n = 7–18. (C) (Left) Photograph of the trap assay in which flies are placed in a round glass container and given a choice between an ammonia-containing tube and a control tube for ∼18 h. (Scale bar: 15 mm.) (Right) Quantification of attraction responses to ammonia and apple juice in flies carrying IR92a-GAL4 driving either UAS-TNT or UAS-impTNT. n = 10–29. For all panels,*P < 0.05; ***P < 0.001; ns, no significant difference by t test. Error bars indicate SEM.
Fig. 4.
Fig. 4.
IR92a, but not IR8a, IR25a, or IR76b, is necessary for glomerular and behavioral responses to ammonia and amines. (A) (Upper Row) Sectioned antennae from flies carrying IR92a-GAL4 and UAS-mCD8GFP immunostained with anti-GFP in green and anti-IR8a (Left) or anti-IR25a in red (Right). (Scale bar: 10 μm.) (Lower Row) The AL of flies carrying UAS-mCD8GFP driven by IR92a-GAL4 (Left) or IR76b-GAL4 (Right) immunostained with anti-GFP in green and nc82 in blue. Arrow depicts the VM1 glomerulus. (Scale bar: 20 µm.) (B) In vivo calcium imaging of IR92a-GAL4; UAS-GCaMP3 flies carrying UAS-Dicer2 and different UAS-RNAi lines or mutations. Quantification of peak ΔF responses of the VM1 glomerulus is shown. *P < 0.05 by ANOVA Tukey test. n = 5–10. Error bars indicate SEM. The UAS-IR92a-RNAi used in this panel is the same as the IR92a-RNAi-2 used in D and in Fig. S3. (C) In vivo calcium imaging of flies ectopically expressing UAS-IR92a driven by IR8a-GAL4 (Upper Row) and control flies carrying IR8a-GAL4 alone (Lower Row). Prestimulation fluorescence micrographs (Far Left) show four glomeruli (VM1, VM4, VC5, and DP1l) of the AL in the focal plane. For each odorant, peak ∆F responses (Left) and calcium traces for each glomerulus (Right) are shown. (Scale bars: 10 µm.) The vertical scale indicates 20% ΔF/F, and the horizontal scale is 1 s; the horizontal black bar below each trace indicates the onset and duration of odor exposure. (D) T-maze behavioral analysis of control IR92a-GAL4 flies (Gal4 alone) and flies carrying IR92a-GAL4, UAS-Dicer2 with two different UAS-IR92a RNAi transgenes or a UAS-IR64a RNAi or a UAS-IR76b RNAi transgene. (E) T-maze behavioral analysis of IR8a or IR25a mutant flies. For D and E, *P < 0.05; ns, no significant difference by ANOVA Tukey-test; n = 7–32. Error bars indicate SEM.
Fig. 5.
Fig. 5.
VM1-PNs are activated specifically by ammonia and amines. (A) Attraction responses of flies expressing either UAS-TNT or UAS-ImpTNT driven by GH146-GAL4 in a T-maze. n = 3–12. *P < 0.05, ***P < 0.0001 by t test. Error bars indicate SEM. (B) Calcium imaging of the AL of flies carrying NP0225-GAL4 and UAS-GCaMP3 responding to different odorants. The VM1 is marked by the dotted line and an arrow. (Scale bar: 10 µm.) (C) Quantification of peak ΔF responses of the VM1 glomerulus. Error bars indicate SEM. n = 4–6.
Fig. 6.
Fig. 6.
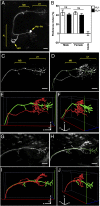
The projection pattern of the VM1-PN is distinct from that of the V-PN and DC4-PN within the LH. (A) Fluorescence micrograph of a single VM1-PN labeled by the PA-GFP technique. (B) Attraction responses to ammonia in flies that received hydroxyurea (HU+) or mock (HU) treatment in a T-maze. n = 12–21; ns, no significant difference by t test. Error bars indicate SEM. (C and D) Representative images of sequential PA-GFP labeling of VM1-PN (C) followed by V-PN (D) in the brain of a fly carrying UAS-SPA/UAS-C3PA, NP0225-GAL4, and NP7273-GAL4. The axonal projections of VM1-PN in D are labeled in green by using the Vaa3D software (66). n = 3. (E and F) The axonal terminals of neurons are labeled in green (VM1-PN) and in red (V-PN) by the auto-estimate radius function of the Vaa3D software and are represented in 3D space in a frontal view (E) and in a side view (F). (G and H) Representative images of sequential PA-GFP labeling of VM1-PN (G) followed by DC4-PN (H) in the brain of a fly carrying UAS-SPA/ UAS-C3PA and Cha-GAL4. n = 3. The axonal projections of the VM1-PN in (H) are labeled in green. (I and J) The axonal terminals of neurons are labeled in green (VM1-PN) and in red (DC4-PN) by Vaa3D software and are represented in 3D space in a frontal view (I) and in a side view (J). (Scale bars: 20 µm.)
Fig. P1.
Fig. P1.
Neuronal components that mediate innate attraction to ammonia and amines. (A) A cartoon diagram of the T-maze–assisted two-choice assay showing that flies are attracted to ammonia and amines. (B) (Left) A schematic of a fly head with regions required for amine-evoked attraction. (Bottom Right) IR92a-positive OSNs are labeled in green, and the antenna is labeled in red. (Middle Right) The antennal lobe is labeled in blue with the VM1 glomerulus stained in green. (Top Right) A 3D representation of the axonal terminals from a single VM1-PN (green) and DC4-PN (red) showing nonoverlapping branches in the lateral horn. (Scale bars: 10 µm.)

References

    1. Vosshall LB, Wong AM, Axel R. An olfactory sensory map in the fly brain. Cell. 2000;102(2):147–159. - PubMed
    1. Clyne PJ, et al. A novel family of divergent seven-transmembrane proteins: Candidate odorant receptors in Drosophila. Neuron. 1999;22(2):327–338. - PubMed
    1. Vosshall LB, Stocker RF. Molecular architecture of smell and taste in Drosophila. Annu Rev Neurosci. 2007;30:505–533. - PubMed
    1. Benton R, Vannice KS, Gomez-Diaz C, Vosshall LB. Variant ionotropic glutamate receptors as chemosensory receptors in Drosophila. Cell. 2009;136(1):149–162. - PMC - PubMed
    1. Abuin L, et al. Functional architecture of olfactory ionotropic glutamate receptors. Neuron. 2011;69(1):44–60. - PMC - PubMed

Publication types