Comparative Study
. 2013 Apr 2;110(14):5582-7.
doi: 10.1073/pnas.1215438110. Epub 2013 Mar 18.

CD133 is a modifier of hematopoietic progenitor frequencies but is dispensable for the maintenance of mouse hematopoietic stem cells

Affiliations
Comparative Study

CD133 is a modifier of hematopoietic progenitor frequencies but is dispensable for the maintenance of mouse hematopoietic stem cells

Kathrin Arndt et al. Proc Natl Acad Sci U S A. .

Abstract

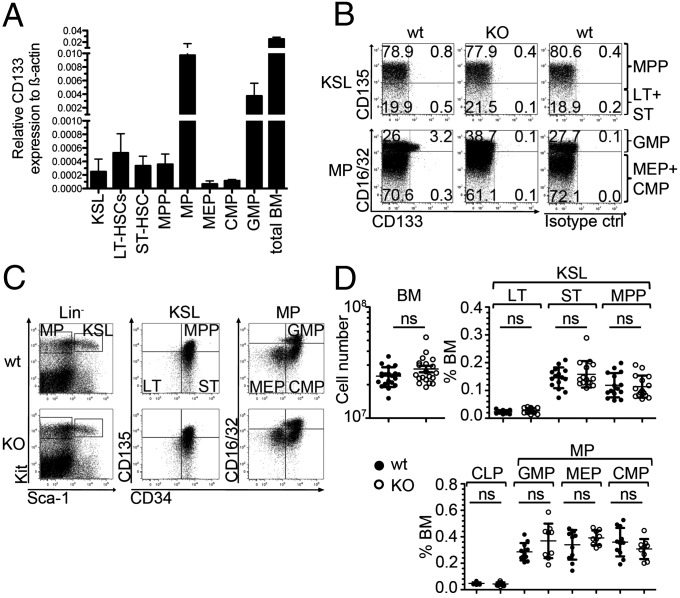
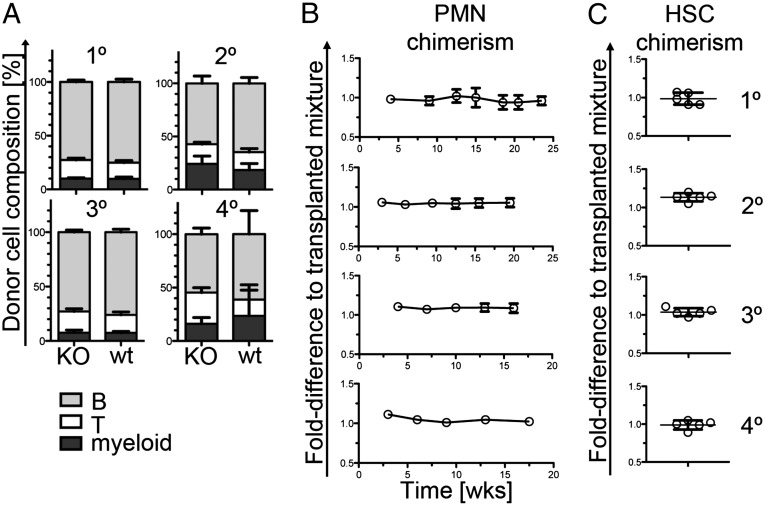
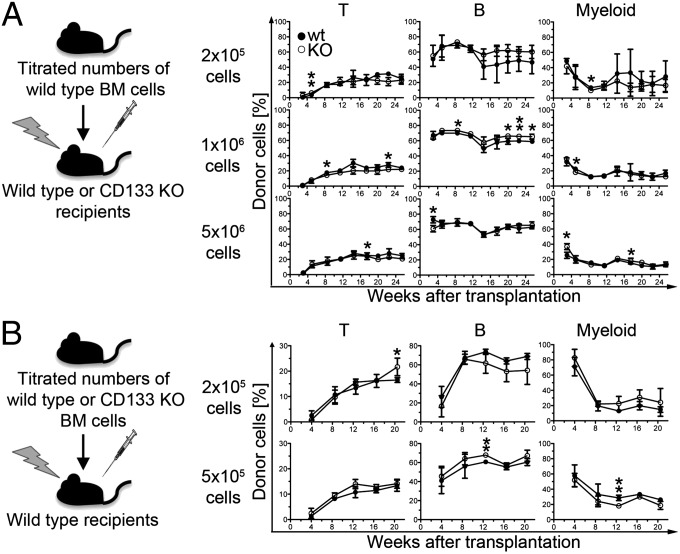
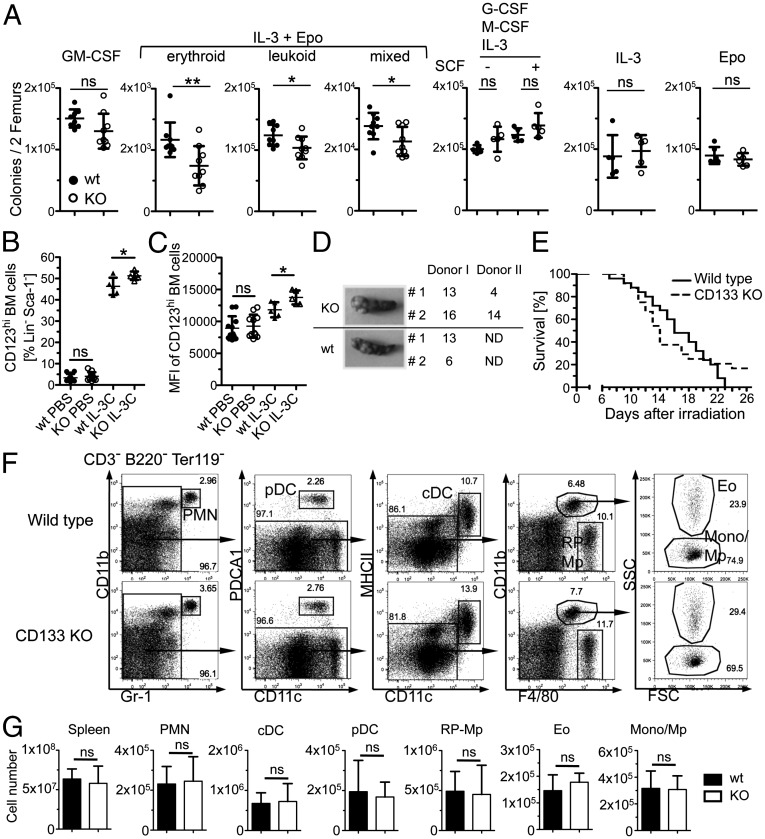
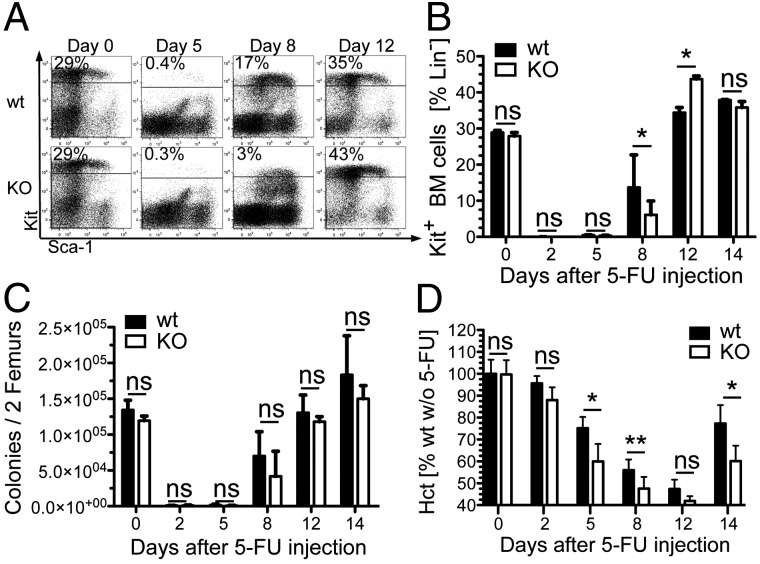
Pentatransmembrane glycoprotein prominin-1 (CD133) is expressed at the cell surface of multiple somatic stem cells, and it is widely used as a cell surface marker for the isolation and characterization of human hematopoietic stem cells (HSCs) and cancer stem cells. CD133 has been linked on a cell biological basis to stem cell-fate decisions in human HSCs and emerges as an important physiological regulator of stem cell maintenance and expansion. Its expression and physiological relevance in the murine hematopoietic system is nevertheless elusive. We show here that CD133 is expressed by bone marrow-resident murine HSCs and myeloid precursor cells with the developmental propensity to give rise to granulocytes and monocytes. However, CD133 is dispensable for the pool size and function of HSCs during steady-state hematopoiesis and after transplantation, demonstrating a substantial species difference between mouse and man. Blood cell numbers in the periphery are normal; however, CD133 appears to be a modifier for the development of growth-factor responsive myeloerythroid precursor cells in the bone marrow under steady state and mature red blood cells after hematopoietic stress. Taken together, these studies show that CD133 is not a critical regulator of hematopoietic stem cell function in mouse but that it modifies frequencies of growth-factor responsive hematopoietic progenitor cells during steady state and after myelotoxic stress in vivo.


Conflict of interest statement

The authors declare no conflict of interest.

Figures

Fig. 1.
Fig. 1.
Expression of CD133 on mouse HSCs/HPCs and its effects on stem or progenitor cell numbers. (A) Quantitative expression analysis of CD133 by indicated purified cell populations (KSL, LT-HSC, ST-HSC, MPP, MP, MEP, CMP, GMP) or total bone marrow (BM) cells from wild-type mice. Results show mean ± SD of CD133 transcript expression relative to transcripts of β-actin (Actb) (n = 2). (B) Dot plots show the expression of CD133 on KSL (Upper) or MP (Lower) of wild-type (wt) (Left) and CD133 KO (KO) (Center) mice. Staining of the isotype control antibody on wild-type cells is depicted (Right). KSL population is further resolved discriminating between MPPs and ST-HSCs (ST) plus LT-HSCs (LT) (Upper), and the MP population is further resolved discriminating between GMP and MEP plus CMP (Lower). Data are representative for eight wild-type and eight CD133 KO mice analyzed in two independent experiments. In all wild-type mice, CD133 cell surface expression was only detected in a fraction of GMPs (2.7 ± 0.9%, n = 8). (C) Dot plots show the expression of Kit versus Sca-1 on lineage negative cells (Lin) (Left), CD135 versus CD34 on KSL cells (Center), and CD16/32 versus CD34 on MPs from wild-type (wt) (Upper) and CD133 KO (KO) (Lower) mice. Data are representative for 15 mice per genotype analyzed in three independent experiments for KSL, and 11 wild-type and 9 CD133 KO mice analyzed in two independent experiments for MP analysis. Data are quantified in D. (D) Plots show the numbers of BM cells and frequencies of LT-HSCs (LT), ST-HSCs (ST), and MPPs or common lymphoid progenitors (CLPs) and MPs separated into MEPs, CMPs, and GMPs in wild-type mice (wt) (closed circles) and CD133 KO mice (KO) (open circles) as shown in C. Data are pooled from three independent experiments using 20 mice per genotype for BM cell numbers, 15 mice per genotype for KSL analysis, and 11 wild-type and 9 CD133 KO mice for CLP and MP analysis. Results represent means ± SD. ns, not significant.
Fig. 2.
Fig. 2.
CD133-deficient HSCs can competitively and serially reconstitute immune cells and the HSC compartment of irradiated recipient mice. (A) Bars show the composition of graft-derived leukocytes (CD3+ T cells, B220+ B cells, and CD11b+ myeloid cells) in the blood of primary (1°), secondary (2°), tertiary (3°), and quaternary (4°) recipient mice 15, 15.5, 16, and 17.5 wk after transplantation, respectively. Lin bone marrow cells of CD133 KO or wild-type mice were mixed with Lin wild-type competitor cells and transplanted into irradiated wild-type recipient mice. All genotypes were identified using antibodies specific for different CD45 isotypes. Five replicate recipient mice for either condition were analyzed. Results represent means ± SD. A significant difference was found between T-cell frequencies in quaternary recipients (P = 0.014). (B) Plots show the fold difference of the ratio of the relative contribution of CD133 KO and wild-type cells to blood neutrophils (PMN). Data are presented as fold difference to the initially transplanted mix of wild-type and CD133 KO HSCs over time. Results show means ± SD of five replicate mice. No statistically significant differences were obtained. (C) Plots show the fold-difference of the ratio of the relative contribution of CD133 KO or wild-type competitor cells to the HSC compartment (KSL) in the bone marrow at the time point of analysis. Data from all replicate mice are shown. Time points of analysis after transplantation were as follows: primary recipients, 24 wk; secondary recipients, 20 wk; tertiary recipients, 16 wk; quaternary recipients, 17.5 wk.
Fig. 3.
Fig. 3.
Graft composition is independent of CD133 on donor or recipient cells. (A) Outline of the experiment (Left): titrated numbers of wild-type bone marrow cells were transplanted into irradiated wild-type or CD133 KO mice and the composition of donor leukocytes monitored over time (Right). Percentages of wild-type–derived (closed circles) or CD133 KO-derived (open circles) T cells (left plot), B cells (center plot), and myeloid cells (right plot) are depicted over time for each donor cell number. At each time point data from two (donor cell number: 2 × 10⁵) or three (donor cell number: 1 × 10⁶ and 5 × 10⁶) recipient mice was pooled. Significant differences were indicated. *P = 0.05–0.01; **P = 0.01–0.001. (B) Titrated numbers of wild-type or CD133 KO bone marrow cells were transplanted into irradiated wild-type recipients. Composition of donor cells in recipient mice that had received 2 × 10⁵ (Upper) or 5 × 10⁵ (Lower) bone marrow cells is depicted as described in A. At each time point, data from four recipients of wild-type cells and two recipients of CD133 KO cells (2 × 10⁵ donor cells) or data from three recipients of wild-type cells and four recipients of CD133 KO cells (5 × 10⁵ donor cells) are shown. Significant differences indicated as described in A.
Fig. 4.
Fig. 4.
Changes in in vitro colony formation and IL-3 receptor expression but no effect on CFU-S formation, sensitivity to γ irradiation, and the pool size of mature myeloid populations. (A) Plots show in vitro colony formation after culture of wild-type or CD133 KO bone marrow cells with GM-CSF, IL-3 plus erythropoietin (Epo), G-CSF plus M-CSF plus IL-3 with and without SCF, IL-3, or Epo (from left to right). Plots show means ± SD of nine mice per genotype (GM-CSF, IL-3+Epo), six mice per genotype (Epo), and five mice per genotype (G-CSF+M-CSF+IL-3± SCF, IL-3). Significant differences were indicated. *P = 0.05–0.01; **P = 0.01–0.001. (B) Plot shows frequency of CD123hi cells in Lin Sca-1 bone marrow cells with or without in vivo stimulation with IL-3 complexes (IL-3C). Results show means ± SD of 11 or 5 mice per genotype for PBS control or IL-3 complex injections, respectively. (C) Plot shows the mean fluorescence intensity (MFI) of CD123 expression on CD123hi cells. Data presentation as described in B. (D) Macroscopically visible colonies in the spleen of recipient mice were counted 8 d [(CFU-S day 8 (CFU-Sd8)] after transplantation of CD133 KO or wild-type bone marrow (BM) cells. Photographs show one representative recipient spleen from each donor. (E) Survival curve of wild-type (solid line) and CD133 KO (broken line) mice after lethal irradiation. Data are pooled from three independent experiments using a total of 25 wild-type or CD133 KO mice. (F) Dot plots show the expression of CD11b vs. Gr-1, PDCA1 vs. CD11c, MHCII vs. CD11c, CD11b vs. F4/80, and side scatter (SSC) vs. forward scatter (FCS) (from left to right) on spleen cells from wild-type (Upper) and CD133 KO (Lower) mice on CD3-, B220-, and Ter119-negative cells. Arrows indicate the population that was further resolved in the following dot plot. cDC, conventional dendritic cells; Eo, eosinophils; Mono/Mp, monocytes/macrophages; pDC, plasmacytoid dendritic cells; PMN, neutrophils; RP-Mp, red pulp macrophages. Data are summarized in E. (G) Graphs show the cell number of spleen cells, PMNs, cDCs, pDCs, RP-Mps, eosinophils, and monocytes/macrophages (from left to right) in wild-type (closed bar) and CD133 KO (open bar) mice identified as shown in C. Means ± SD are given (n = 6 mice per genotype).
Fig. 5.
Fig. 5.
CD133 KO mice have a compromised recovery after myelotoxic stress in vivo. (A) Dot plots show the frequency of Kit and Sca-1 cell surface expression on Lin bone marrow cells from wild-type (Upper) and CD133 KO mice (Lower) at the indicated time point after injection of 5-FU. Data are representative for 2 (day 0, 5, and 12) and 13 (day 8) mice per genotype. Three independent experiments were performed, and the data from all mice are summarized in B. (B) Plot shows the frequency of Kit+ bone marrow cells in the Lin compartment of wild-type (solid bars) and CD133 KO (open bars) mice at the indicated time points after injection of 5-FU. Mean and SD are given [n = 2 (day 0, 2, 5, 12, and 14) or n = 13 (day 8) mice per genotype]. *P = 0.05–0.01; **P = 0.01–0.001. Data are pooled from three independent experiments as outlined in A. (C) Colony numbers per two femurs from wild-type (closed bars) or CD133 KO (open bars) mice in methylcellulose-containing medium supplemented with IL-3 and Epo at the indicated time points after 5-FU injection are shown. Data presentation and mice analyzed are as described in B. (D) Plot depicts the hematocrit (Hct) calculated as percentage from the average Hct of wild-type mice without 5-FU at the indicated time points after 5-FU injection. Data of wild-type (closed bars) or CD133 KO (open bars) mice from two independent experiments were pooled. Means ± SD are given [n = 9 (day 0 and 8), n = 4 (day 2 and 5), and n = 5 wild-type and n = 4 CD133 KO (day 12 and 14) mice per genotype].

References

    1. Orkin SH, Zon LI. Hematopoiesis: An evolving paradigm for stem cell biology. Cell. 2008;132(4):631–644. - PMC - PubMed
    1. Kosodo Y, et al. Asymmetric distribution of the apical plasma membrane during neurogenic divisions of mammalian neuroepithelial cells. EMBO J. 2004;23(11):2314–2324. - PMC - PubMed
    1. Wang X, et al. Asymmetric centrosome inheritance maintains neural progenitors in the neocortex. Nature. 2009;461(7266):947–955. - PMC - PubMed
    1. Cheng J, et al. Centrosome misorientation reduces stem cell division during ageing. Nature. 2008;456(7222):599–604. - PMC - PubMed
    1. Beckmann J, Scheitza S, Wernet P, Fischer JC, Giebel B. Asymmetric cell division within the human hematopoietic stem and progenitor cell compartment: Identification of asymmetrically segregating proteins. Blood. 2007;109(12):5494–5501. - PubMed

Publication types

MeSH terms