. 2013 Apr 8;210(4):699-714.
doi: 10.1084/jem.20122609. Epub 2013 Mar 18.

In vivo fate mapping identifies pre-TCRα expression as an intra- and extrathymic, but not prethymic, marker of T lymphopoiesis

Affiliations

In vivo fate mapping identifies pre-TCRα expression as an intra- and extrathymic, but not prethymic, marker of T lymphopoiesis

Hervé Luche et al. J Exp Med. .

Abstract

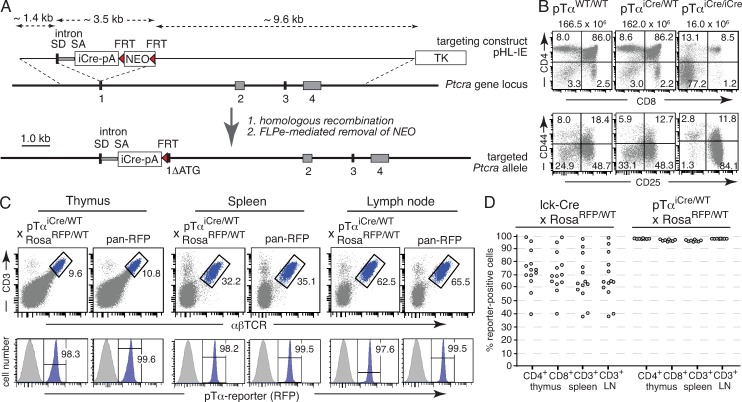
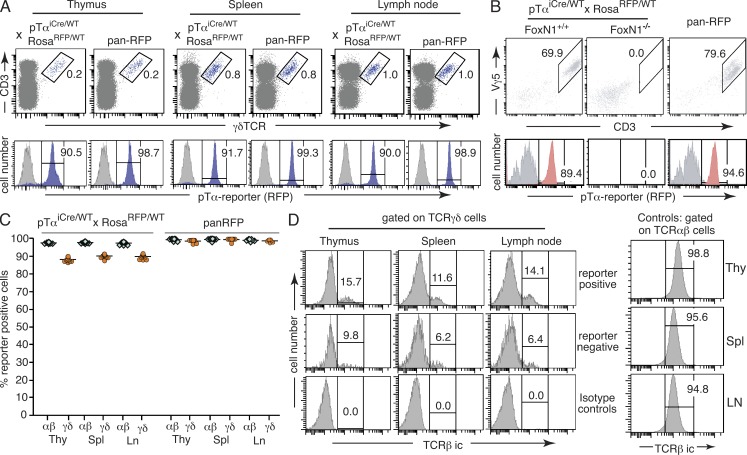
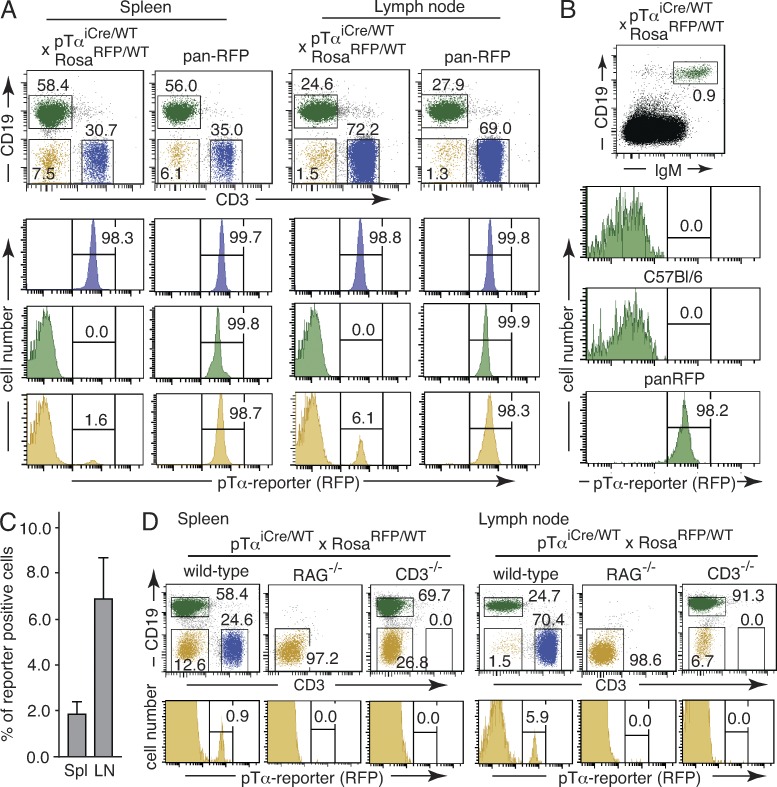
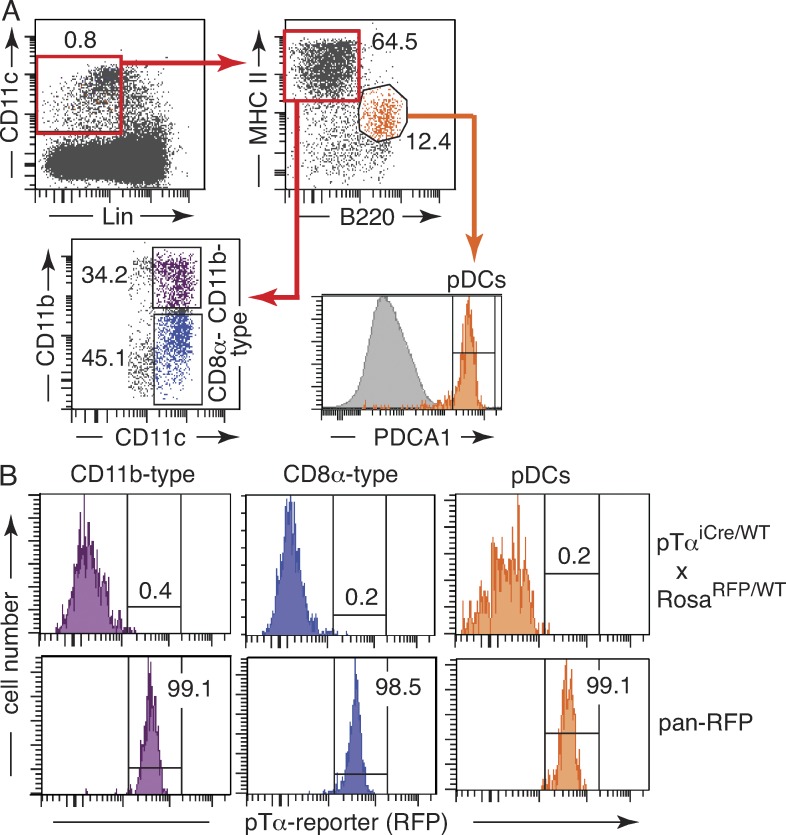
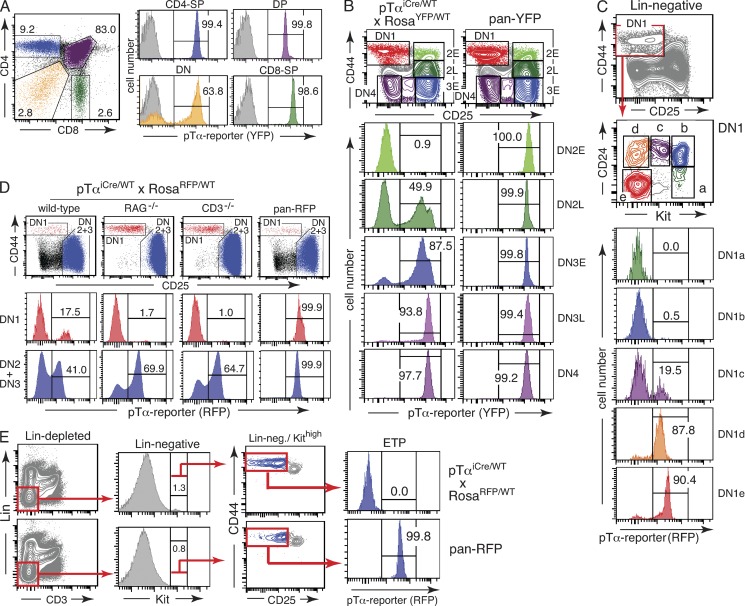
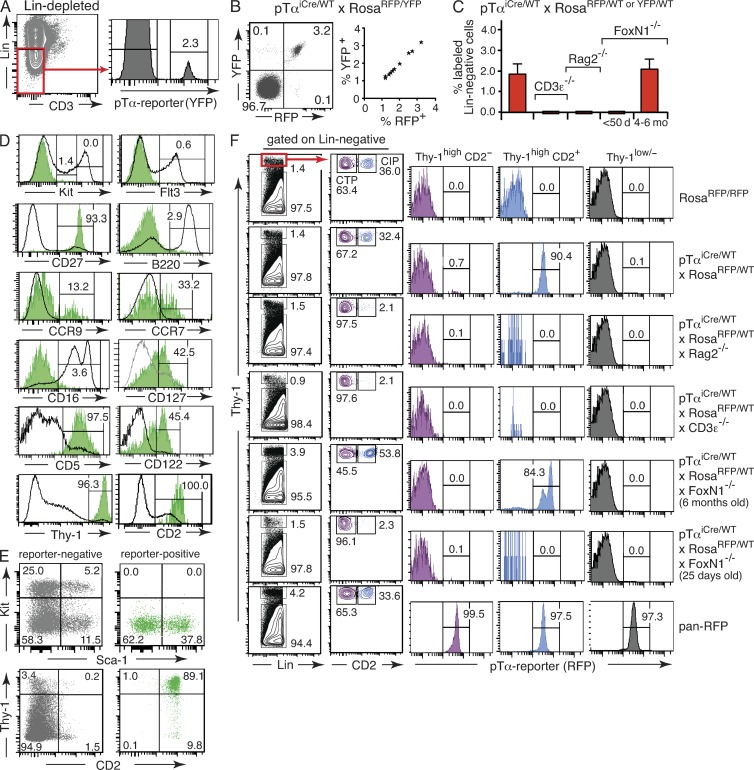
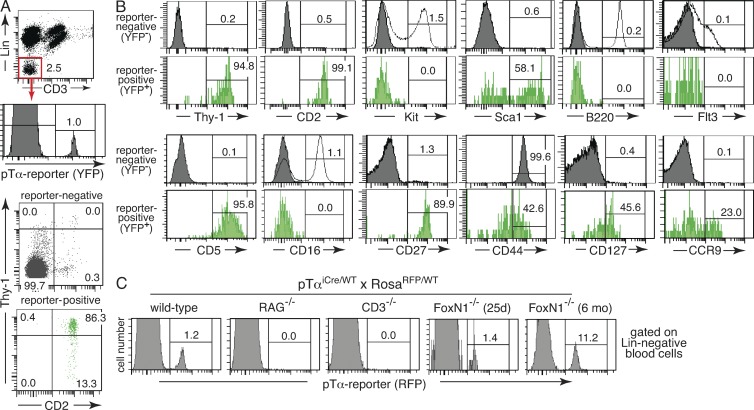
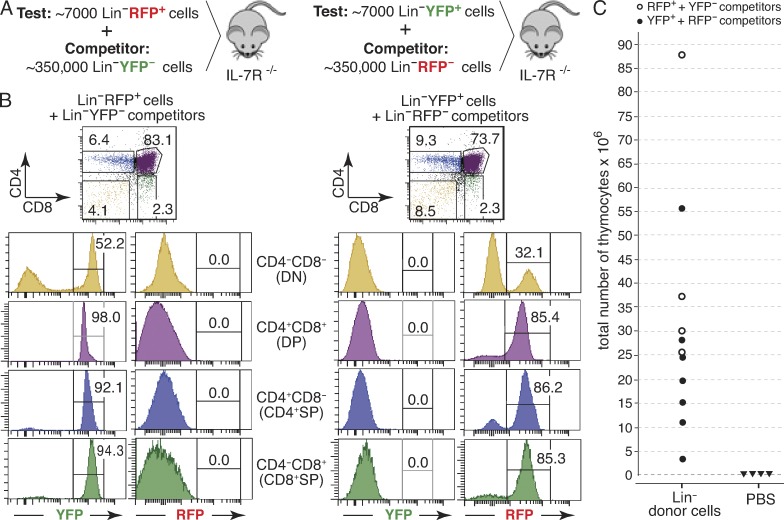
Expression of the pre-T cell receptor α (pTα) gene has been exploited in previous studies as a molecular marker to identify tiny cell populations in bone marrow (BM) and blood that were suggested to contain physiologically relevant thymus settling progenitors (TSPs). But to what extent these cells genuinely contribute to thymopoiesis has remained obscure. We have generated a novel pTα(iCre) knockin mouse line and performed lineage-tracing experiments to precisely quantitate the contribution of pTα-expressing progenitors to distinct differentiation pathways and to the genealogy of mature hematopoietic cells under physiological in vivo conditions. Using these mice in combination with fluorescent reporter strains, we observe highly consistent labeling patterns that identify pTα expression as a faithful molecular marker of T lineage commitment. Specifically, the fate of pTα-expressing progenitors was found to include all αβ and most γδ T cells but, in contrast to previous assumptions, to exclude B, NK, and thymic dendritic cells. Although we could detect small numbers of T cell progenitors with a history of pTα expression in BM and blood, our data clearly exclude these populations as physiologically important precursors of thymopoiesis and indicate that they instead belong to a pathway of T cell maturation previously defined as extrathymic.


Figures

Figure 1.
Figure 1.
Generation of pTαiCre knockin mice. (A) Targeting strategy. Gray rectangles represent exons; red triangles represent FRT sites. TK indicates the thymidine kinase gene and NEO an expression cassette encoding neomycin resistance. SD and SA mark splice donor and acceptor sites flanking an intron, all derived from the rabbit β-globin locus; ΔATG indicates deletion of the Ptcra start codon upon targeted insertion of the iCre-pA cassette. (B) Thymocytes were isolated from mice of the indicated genotypes and analyzed by flow cytometry. Top panels show representative CD4/CD8 profiles of total thymocytes, and bottom panels show corresponding CD44/CD25 profiles of thymocytes pregated on Lin cells. The total number of thymocytes is shown on top of each panel. Numbers in dot plots indicate percentages of cells in each quadrant. (C) Thymocytes, splenocytes, and lymph node cells were isolated from a pTαiCre/WT × RosaRFP/WT mouse and a pan-RFP control animal, and expression of the pTα reporter was determined by flow cytometry. Gates in the top panels identify αβ T cells, and blue histograms in the panels below depict pTα reporter expression in gated cells. The gray histograms correspond to αβ T cells from a RosaRFP/RFP mouse lacking iCre expression as negative control. Pan-RFP refers to a positive control mouse carrying one constitutively activated RosaRFP allele. Numbers indicate percentages of cells in each gate. (D) Comparison of labeling efficiencies in T cell compartments of conventional lck-Cre transgenic (n = 13) and newly generated pTαiCre knockin mice (n = 8) both intercrossed with RosatdRFP reporter mice. Circles correspond to data from individual animals.
Figure 2.
Figure 2.
Quantification of past pTα expression in TCRγδ cells. (A) Dot plots in top row show the gating scheme to identify TCRγδ–expressing cells; the histograms below show the percentage of gated TCRγδ+ cells with a history of pTαiCre expression. The underlying gray histograms represent TCRγδ cells from a RosaRFP/RFP mouse lacking iCre expression as negative control. A pan-RFP mouse (carrying one constitutively active RosaRFP allele) was used as positive control. Numbers indicate percentages of cells in each gate. (B) DETCs were isolated from skin as CD3+TCRVγ5+ cells, and expression of the pTα reporter was assessed by flow cytometry. A nude mouse (FoxN1−/−) lacking DETCs was included as specificity control for CD3/Vγ5 stainings; other controls as in A. Populations were pregated on CD45+ cells. Red histograms refer to pTα reporter expression in gated CD45+CD3+TCRVγ5+ cells. Numbers indicate percentages of cells in each gate. Equivalent results were obtained in two independent experiments. (C) The frequency of reporter-positive cells was compared between TCRαβ+ and TCRγδ+ cells in thymus (Thy), spleen (Spl), and lymph nodes (Ln). Relevant cell populations were identified by flow cytometry as shown in Fig. 1 C and panel A. Each data point represents an individual mouse, with green diamonds referring to TCRαβ+ and orange circles to TCRγδ+ cells. Data were obtained from 12 pTαiCre/WT × RosaRFP/WT reporter and 8 pan-RFP control mice. (D) The frequency of TCRγδ+ cells with intracellular (ic) TCRβ expression in reporter-positive and -negative populations was determined by flow cytometry. Gating for TCRγδ+ cells as in A. Numbers indicate percentages of cells in each gate. Data are representative of three independent experiments.
Figure 3.
Figure 3.
pTαiCre expression is confined to the T lineage. (A) Splenocytes and lymph node cells were isolated from a pTαiCre/WT × RosaRFP/WT mouse and a pan-RFP control animal, and expression of the pTα reporter was assessed by flow cytometry. Dot plots on top provide the gating scheme for the histograms depicted below. CD3+ T cells are shown in blue, CD19+ B-cells in green, and cells lacking surface expression of both CD3 and CD19 in yellow. Numbers indicate percentages of cells in each gate. The figure is representative of 13 individual pTαiCre/WT × RosaRFP/WT and 5 pan-RFP mice. (B) Mature B lymphocytes in lineage-depleted thymic cell populations (see Materials and methods) were identified as CD19+IgM+ cells (dot plot on top). The histograms below show reporter expression in gated CD19+IgM+ cells from thymi of a pTαiCre/WT × RosaRFP/WT mouse (top), a C57BL/6 negative control (middle), and a pan-RFP positive control mouse (bottom). Numbers indicate percentages of cells in each gate. Data are representative of three separate experiments with five individual pTαiCre/WT × RosaRFP/WT reporter mice. (C) Bar graph indicates the mean percentage of reporter-positive splenocytes (Spl) and lymph node cells within the CD3CD19 population of pTαiCre/WT × RosaRFP/WT reporter mice (n = 13). Error bars indicate SD. (D) Splenocytes and lymph node cells from pTαiCre/WT × RosaRFP/WT reporter mice on the indicated genetic backgrounds were analyzed for RFP expression. Dot plots on top show the gating scheme, and enlarged histograms below show reporter expression in the corresponding CD3CD19 populations. Numbers indicate percentages of cells in each gate. Data are representative of five separate experiments with a total of five mice of each mutant genotype.
Figure 4.
Figure 4.
No evidence for current or past pTαiCre expression in thymic DCs. (A) Gating scheme to distinguish thymic DC subsets. After digestion of thymi (see Materials and methods), conventional thymic DCs were identified in the resultant single cell suspensions as LinCD11c+MHC class IIhighB220 cells and further fractionated in CD11b-type DCs (purple) and CD8a-type DCs (blue) based on CD11b expression. Plasmacytoid DCs (pDCs; orange) were identified as LinCD11c+MHC class IIlowB220+ cells expressing plasmacytoid DC antigen-1 (PDCA1). The underlying gray histogram refers to PDCA1 staining of total thymocytes. Numbers indicate percentages of cells in each gate. (B) Reporter expression in CD11b-type, CD8a-type, and plasmacytoid DCs isolated from thymi of a pTαiCre/WT × RosaRFP/WT mouse and a pan-RFP control animal. Numbers indicate percentages of cells in each gate. Equivalent results were obtained in three independent experiments with a total of seven pTαiCre/WT × RosaRFP/WT and three pan-RFP mice.
Figure 5.
Figure 5.
Onset of pTαiCre expression in thymopoiesis. (A) Total thymocytes of a pTαiCre/WT × RosaYFP/WT mouse were analyzed by flow cytometry for reporter expression in CD4/CD8 thymocyte subsets. Single-positive (SP), DP, and DN thymocytes were delineated as shown in the dot plot on the left. The underlying gray histograms correspond to thymocytes from a RosaYFP/YFP mouse lacking iCre expression analyzed in the same experiment with identical gates. (B) Lin thymocytes (lineage depleted and electronically gated; see Materials and methods) were separated into developmentally successive subpopulations based on CD25 and CD44 expression (top). Color-coded histograms (bottom) show pTα reporter expression in the respective CD25/CD44 subsets. (C) DN1 thymocytes (LinCD44+CD25) were separated into five distinct subsets based on CD24 and Kit expression. Color-coded histograms refer to the respective Kit/CD24 subset in the dot plot above. Combined DN1a + DN1b subsets correspond to ETPs. (D) DN1 and combined DN2 + DN3 thymocyte compartments (top) of pTαiCre/WT × RosaRFP/WT mice on indicated genetic backgrounds were analyzed by flow cytometry to determine the percentage of reporter-positive cells. Color-coded histograms (bottom) show pTα reporter expression in the respective subsets. Numbers indicate percentages of cells in each gate. (E) Flow cytometric analysis of ETPs for pTα reporter expression using an alternative gating scheme. Arrows indicate the gating hierarchy to identify ETPs, defined as LinKithighCD44highCD25−/low cells. Numbers indicate percentages of cells in each gate. All data are representative of at least three independent experiments.
Figure 6.
Figure 6.
Characterization of reporter-positive cells in BM. (A) Gating scheme to identify reporter-positive cells in Lin BM. The number in the histogram refers to the percentage of reporter-positive cells. (B) Flow cytometric analysis of dual reporter expression in Lin BM cells from pTαiCre/WT × RosaRFP/YFP mice, harboring both an RFP and an YFP reporter allele. Dot plot to the left shows labeling pattern in a representative animal, and the graph to the right summarizes data from 11 animals; each star corresponds to an individual mouse; pregating as in A. (C) Mean percentage of reporter-positive cells in Lin BM of mice with different genetic backgrounds. Designations below graphs refer to the age of FoxN1−/− mice in the respective cohort. Error bars denote SD (pTαiCre/WTxRosaRFP/WT or YFP/WT on WT background, n = 15; on CD3ε−/− background, n = 16; on Rag2−/− background, n = 11; on FoxN1−/− background, younger than 50 d, n = 7; on FoxN1−/− background, 4–6 mo old, n = 3). (D) Cell surface phenotype of reporter-positive Lin cells (green histograms). Black line histograms refer to the expression pattern of the respective surface marker on total Lin cells (red gate in A). Numbers indicate percentages of cells in each gate. Each histogram is representative of three independent experiments. (E) Kit/Sca-1 and Thy-1/CD2 cell surface phenotype of reporter-positive and -negative Lin cells. Numbers indicate percentages of cells in each quadrant. Dot plots are representative of two independent experiments. (F) Reporter expression in LinThy-1low/− and previously described CTP and CIP populations (García-Ojeda et al., 2005). Color codes refer to gated Thy-1/CD2 subsets, as indicated on top of each histogram. Numbers indicate percentages of cells in each gate. Data are representative of at least five animals of each genotype.
Figure 7.
Figure 7.
Analysis of peripheral blood from adult pTα reporter mice. (A) Gating scheme to identify reporter-positive cells within the Lin population (top two panels). Numbers refer to the percentages of cells in the respective gates. Dot plots (bottom) reveal the Thy-1/CD2 surface phenotype of reporter-positive and -negative Lin blood cells. The numbers refer to the percentage of cells in each quadrant. Data were obtained with pooled blood from eight pTαiCre/WT × RosaYFP/WT reporter mice and are representative of two independent experiments. (B) Cell surface phenotype of reporter-positive and -negative cell subsets, pregated as shown in A. The open lines in some histograms refer to the expression pattern of the respective surface marker (Kit, B220, Flt3, CD16) on Lin BM cells, which were stained in the same experiment to provide positive controls. Numbers refer to the percentage of blood cells positive for the respective surface marker. Each histogram is derived from pooled blood of two to three animals and representative of three independent staining experiments. (C) Flow cytometric analysis of pTα reporter expression in Lin peripheral blood of pTαiCre/WT × RosaRFP/WT mice bred on the indicated genetic backgrounds. The information in brackets refers to the age of the particular mouse. All cells were pregated on the Lin population as shown in A. Numbers indicate percentages of cells in each gate. Data are representative of three independent experiments, including all mouse genotypes shown.
Figure 8.
Figure 8.
pTαiCre-labeled BM cells lack TSP activity. (A) Outline of the competitive complementation transfer experiment. Approximately 7,000 LinRFP+ cells sorted from pooled BM of female pTαiCre/WT × RosaRFP/WT mice were mixed with ∼350,000 LinYFP cells sorted from pooled BM of female pTαiCre/WT × RosaYFP/WT mice and injected i.v. into an unconditioned IL-7Rα−/− female mouse (left). In the reciprocal experiment, ∼7,000 LinYFP+ cells sorted from pooled BM of the pTαiCre/WT × RosaYFP/WT mice were mixed with ∼350,000 LinRFP cells sorted from pooled BM of the pTαiCre/WT × RosaYFP/WT mice and also injected i.v. into an unconditioned IL-7Rα−/− female mouse (right). On day 14 after injection, thymocytes of recipient mice were isolated and analyzed for the ratio of red versus yellow donor cells in CD4/CD8 thymic subsets. (B) Cytofluorometric analysis of recipient thymi from two representative IL-7R−/− mice, reconstituted i.v. with a mixture of RFP+/YFP (left) or YFP+/RFP (right) Lin donor BM cells 14 d earlier. Total numbers of recovered thymocytes were 37 × 106 and 28.4 × 10⁶, respectively. Two independent experiments gave identical results: fluorescently labeled thymocytes were derived exclusively (100%) from the reporter-negative donor cell fraction in 4/4 recipients of RFP+/YFP and in 7/7 recipients of YFP+/RFP Lin cells. (C) Total number of thymocytes in IL-7R−/− recipients 14 d after receiving RFP+/YFP (open circles) or YFP+/RFP Lin cells (closed circles). Control recipients were injected with PBS only (closed triangles).

Similar articles

Cited by

References

    1. Aifantis I., Azogui O., Feinberg J., Saint-Ruf C., Buer J., von Boehmer H. 1998. On the role of the pre-T cell receptor in alphabeta versus gammadelta T lineage commitment. Immunity. 9:649–655 10.1016/S1074-7613(00)80662-7 - DOI - PubMed
    1. Akashi K., Richie L.I., Miyamoto T., Carr W.H., Weissman I.L. 2000. B lymphopoiesis in the thymus. J. Immunol. 164:5221–5226 - PubMed
    1. Allman D., Sambandam A., Kim S., Miller J.P., Pagan A., Well D., Meraz A., Bhandoola A. 2003. Thymopoiesis independent of common lymphoid progenitors. Nat. Immunol. 4:168–174 10.1038/ni878 - DOI - PubMed
    1. Benz C., Martins V.C., Radtke F., Bleul C.C. 2008. The stream of precursors that colonizes the thymus proceeds selectively through the early T lineage precursor stage of T cell development. J. Exp. Med. 205:1187–1199 10.1084/jem.20072168 - DOI - PMC - PubMed
    1. Bhandoola A., Sambandam A. 2006. From stem cell to T cell: one route or many? Nat. Rev. Immunol. 6:117–126 10.1038/nri1778 - DOI - PubMed

Publication types

MeSH terms

Substances