

An evolutionary perspective on epistasis and the missing heritability
- PMID: 23509438
- PMCID: PMC3585114
- DOI: 10.1371/journal.pgen.1003295
An evolutionary perspective on epistasis and the missing heritability
Abstract
The relative importance between additive and non-additive genetic variance has been widely argued in quantitative genetics. By approaching this question from an evolutionary perspective we show that, while additive variance can be maintained under selection at a low level for some patterns of epistasis, the majority of the genetic variance that will persist is actually non-additive. We propose that one reason that the problem of the "missing heritability" arises is because the additive genetic variation that is estimated to be contributing to the variance of a trait will most likely be an artefact of the non-additive variance that can be maintained over evolutionary time. In addition, it can be shown that even a small reduction in linkage disequilibrium between causal variants and observed SNPs rapidly erodes estimates of epistatic variance, leading to an inflation in the perceived importance of additive effects. We demonstrate that the perception of independent additive effects comprising the majority of the genetic architecture of complex traits is biased upwards and that the search for causal variants in complex traits under selection is potentially underpowered by parameterising for additive effects alone. Given dense SNP panels the detection of causal variants through genome-wide association studies may be improved by searching for epistatic effects explicitly.
Conflict of interest statement
The authors have declared that no competing interests exist.
Figures
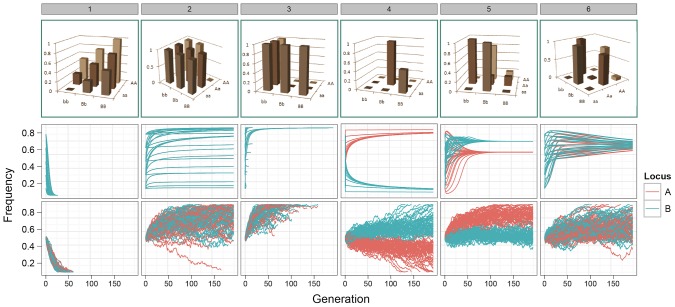
 -axis correspond to alleles a/b. Only one colour appears for patterns 1–3 because the trajectories of both alleles are identical. Bottom row: The path of allele frequencies as observed through stochastic simulations of populations comprising 1000 individuals and
  at generation 0, with initial allele frequencies at both loci of 0.5.
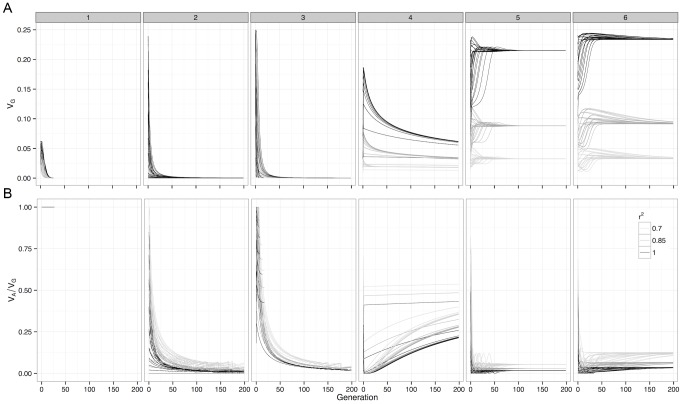
 ), and at SNP pairs that were in incomplete LD with the causal loci. Boxes represent the different G-P maps from Figure 1.
 ; 4:
; 4:  ; 5:
; 5:  .
.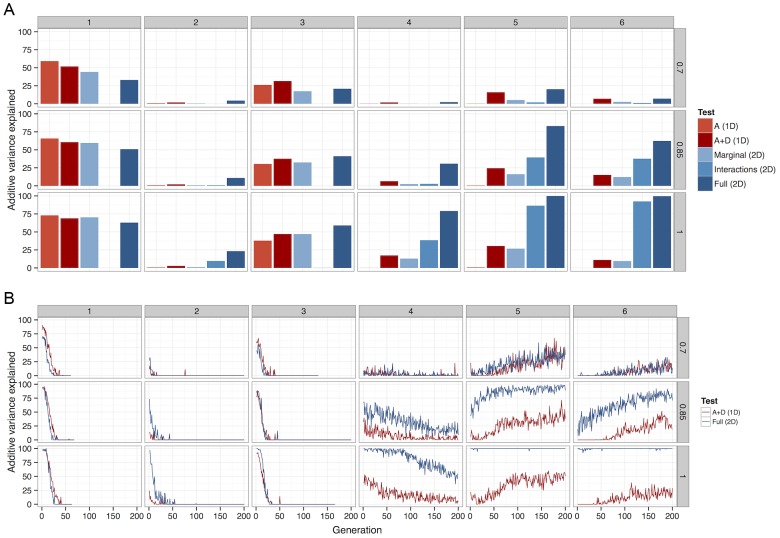
 between causal variants and observed SNPs. (a) Deterministic calculations were performed 25 times, each with different initial allele frequencies. The percentage of additive variance explained is summed across all runs and generations. (b) The summed
  detected at each generation as a percentage of the summed
  simultaneously present in 50 populations. For clarity, only the most powerful 1D test (A+D) is compared against the most powerful 2D test (full parameterisation). A Bonferroni threshold was used,
  for 1D strategies and
  for 2D strategies.
References
-
- Lynch M, Walsh B (1997) Genetics and analysis of quantitative traits. Sinauer Associates, Inc.
-
- Bradshaw AD (1991) The Croonian Lecture, 1991. Genostasis and the limits to evolution. Philosophical transactions of the Royal Society of London Series B, Biological sciences 333: 289–305. - PubMed
-
- Williams GC (1992) Natural Selection: Domains, Levels, and Challenges. Oxford: Oxford University press.
-
- Hansen T, Houle D (2004) Evolvability, stabilizing selection, and the problem of stasis. In: The evolutionary biology of complex phenotypes, Oxford University press. pp. 130–150.
Publication types
MeSH terms
Grants and funding
- BBS/E/D/20211553/BB_/Biotechnology and Biological Sciences Research Council/United Kingdom
- BBS/E/D/20211554/BB_/Biotechnology and Biological Sciences Research Council/United Kingdom
- MC_PC_U127592696/MRC_/Medical Research Council/United Kingdom
- MC_U127592696/MRC_/Medical Research Council/United Kingdom
LinkOut - more resources
Full Text Sources
Other Literature Sources
