Falls risk and simulated driving performance in older adults
- PMID: 23509627
- PMCID: PMC3595928
- DOI: 10.1155/2013/356948
Falls risk and simulated driving performance in older adults
Abstract
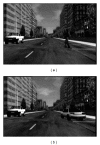
Declines in executive function and dual-task performance have been related to falls in older adults, and recent research suggests that older adults at risk for falls also show impairments on real-world tasks, such as crossing a street. The present study examined whether falls risk was associated with driving performance in a high-fidelity simulator. Participants were classified as high or low falls risk using the Physiological Profile Assessment and completed a number of challenging simulated driving assessments in which they responded quickly to unexpected events. High falls risk drivers had slower response times (~2.1 seconds) to unexpected events compared to low falls risk drivers (~1.7 seconds). Furthermore, when asked to perform a concurrent cognitive task while driving, high falls risk drivers showed greater costs to secondary task performance than did low falls risk drivers, and low falls risk older adults also outperformed high falls risk older adults on a computer-based measure of dual-task performance. Our results suggest that attentional differences between high and low falls risk older adults extend to simulated driving performance.
Figures


References
-
- Evans L. Traffic Safety. Bloomfield Hills, Mich, USA: Science Serving Society; 2004.
-
- Clay OJ, Wadley VG, Edwards JD, Roth DL, Roenker DL, Ball KK. Cumulative meta-analysis of the relationship between useful field of view and driving performance in older adults: current and future implications. Optometry & Vision Science. 2005;82(8):724–731. - PubMed
-
- Hoffman L, Atchley P, McDowd JM, Dubinsky R. The role of visual attention in predicting driving impairment in older adults. Psychology and Aging. 2005;20(4):610–622. - PubMed
-
- Woollacott M, Shumway-Cook A. Attention and the control of posture and gait: a review of an emerging area of research. Gait & Posture. 2002;16(1):1–14. - PubMed
-
- Kerr B, Condon SM, McDonald LA. Cognitive spatial processing and the regulation of posture. Journal of Experimental Psychology. 1985;11(5):617–622. - PubMed
LinkOut - more resources
Full Text Sources
Other Literature Sources

