. 2013 Mar 19:14:193.
doi: 10.1186/1471-2164-14-193.

Dynamic regulation of epigenomic landscapes during hematopoiesis

Affiliations

Dynamic regulation of epigenomic landscapes during hematopoiesis

Brian J Abraham et al. BMC Genomics. .

Abstract

Background: Human blood develops from self-renewing hematopoietic stem cells to terminal lineages and necessitates regulator and effector gene expression changes; each cell type specifically expresses a subset of genes to carry out a specific function. Gene expression changes coincide with histone modification, histone variant deposition, and recruitment of transcription-related enzymes to specific genetic loci. Transcriptional regulation has been mostly studied using in vitro systems while epigenetic changes occurring during in vivo development remain poorly understood.

Results: By integrating previously published and novel global expression profiles from human CD34+/CD133+ hematopoietic stem and progenitor cells (HSPCs), in vivo differentiated human CD4+ T-cells and CD19+ B-cells, and in vitro differentiated CD36+ erythrocyte precursors, we identified hundreds of transcripts specifically expressed in each cell type. To relate concurrent epigenomic changes to expression, we examined genome-wide distributions of H3K4me1, H3K4me3, H3K27me1, H3K27me3, histone variant H2A.Z, ATP-dependent chromatin remodeler BRG1, and RNA Polymerase II in these cell types, as well as embryonic stem cells. These datasets revealed that numerous differentiation genes are primed for subsequent downstream expression by BRG1 and PolII binding in HSPCs, as well as the bivalent H3K4me3 and H3K27me3 modifications in the HSPCs prior to their expression in downstream, differentiated cell types; much HSPC bivalency is retained from embryonic stem cells. After differentiation, bivalency resolves to active chromatin configuration in the specific lineage, while it remains in parallel differentiated lineages. PolII and BRG1 are lost in closer lineages; bivalency resolves to silent monovalency in more distant lineages. Correlation of expression with epigenomic changes predicts tens of thousands of potential common and tissue-specific enhancers, which may contribute to expression patterns and differentiation pathways.

Conclusions: Several crucial lineage factors are bivalently prepared for their eventual expression or repression. Bivalency is not only resolved during differentiation but is also established in a step-wise manner in differentiated cell types. We note a progressive, specific silencing of alternate lineage genes in certain cell types coinciding with H3K27me3 enrichment, though expression silencing is maintained in its absence. Globally, the expression of type-specific genes across many cell types correlates strongly with their epigenetic profiles. These epigenomic data appear useful for further understanding mechanisms of differentiation and function of human blood lineages.


Figures

Figure 1
Figure 1
Many transcripts show cell type-specific expression in hematopoietic subsets. (A) All blood cells derive from hematopoietic stem and progenitor cells (HSPCs) through common progenitors, including the common lymphoid and common myeloid progenitors (CLP, CMP). T and B-cells arise from CLPs, whereas red blood cell precursors (pRBCs) differentiate from CMPs. (B) Pairwise comparison of expression profiles from four cell types results in many differentially expressed transcripts but relatively few transcripts with cell type-specific expression. Total: the number of differentially expressed genes between two cell types. The numbers of cell type-specific genes are indicated below the panel.
Figure 2
Figure 2
Chromatin profiles around TSSs of type-specific genes show extensive priming in progenitor cells during differentiation. (A) – (E) Histone modification, BRG1 binding and RNA Polymerase II binding profiles around TSSs of HSPC-specific genes are displayed for (A) ESC, (B) HSPC, (C) pRBC, (D) B-cell, and (E) T-cell. (F) – (J) Histone modification, BRG1 binding and RNA Polymerase II binding profiles around TSSs of B-cell-specific genes are displayed for (F) ESC, (G) HSPC, (H) pRBC, (I) B-cell, and (J) T-cell.
Figure 3
Figure 3
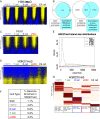
H3K4me3 profiles are consistent but H3K27me3-enriched regions change drastically during differentiation. (A) Heatmaps of H3K4me3 around TSSs sorted into 200 groups by HSPC expression show stable marking of the most highly expressed genes across all cell types and a depletion directly at the TSS. (B) Promoters consistently marked by H3K4me3 in the four hematopoietic cell types contain a CpG island more often than those that are inconsistently or not marked by H3K4me3. (C) RNA PolII heatmaps around TSSs sorted into 200 groups by HSPC expression show PolII binding at the most highly expressed genes directly at the TSS. (D) H3K27me3 heatmaps around TSSs sorted into 200 groups by HSPC expression show enrichment in the lowest expressed genes. (E) The distributions of the sizes of H3K27me3-enriched regions in ESC (black dotted), HSPC (grey), pRBC (red), T-cell (green), and B-cell (blue) show that H3K27me3-enriched regions grow in size in differentiated cell types in comparison with ESCs and HSPCs. (F) Percentages of the genome falling in SICER islands calculated for H3K27me3. (G) Most of the H3K27me3-enriched regions are cell type-specific. Regions of H3K27me3 enrichment were unified across all five cell types, broken evenly into ≤ 2kbp fragments, clustered by their H3K27me3 read counts, and displayed as a heatmap.
Figure 4
Figure 4
Bivalent priming of TSSs is prevalent and its resolution varies during differentiation. (A) Resolution and formation of bivalency during differentiation. Each column represents a gene bivalent in any of our cell types and is colored in the cell types in which it is bivalent. Columns/genes were grouped by their bivalency across cell types. (B) Bottom panels represent genes bivalently marked outside the HSPC stage. The number of genes possessing H3K4me3 but lacking H3K27me3 in HSPCs (red), possessing H3K27me3 but lacking H3K4me3 in HSPCs (green), and possessing neither in HSPCs (black) are shown. (C) The T-cell regulator GATA3 shows bivalent priming and resolution. In ESCs (black), HSPCs (grey) and B-cells (blue) the GATA3 promoter (TSS +/− 0.5kbp) is enriched with H3K4me3 and H3K27me3 and is not transcribed. In pRBCs (red), only H3K27me3 is found. In T-cells (green), GATA3 is bound by PolII and is transcribed. (D) The B-cell master regulator PAX5 is bivalently marked in ESCs (black), HSPCs (grey) and T-cells (green). It is bound by PolII in HSPCs as well. In pRBCs (red), H3K4me3 is lost, leaving only H3K27me3. In B-cells (blue), PAX5 is enriched in H3K4me3, bound by PolII, and uniquely expressed. (E) Genes specifically expressed in downstream lineages are bivalently prepared in HSPC and ESC.
Figure 5
Figure 5
The chromatin environment at core potential enhancers (CPEs) remains stable across cell types. (A) Counts of H2A.Z/H3K4me1-enriched regions and CSPEs in each cell type. (B) – (E) Chromatin profiles of size-normalized CPEs in (B) HSPCs, (C) T-cells, (D) B-cells, and (E) pRBCs all show enrichment of H3K4me1 and H2A.Z by definition. They are also all enriched in Brg1, H3K4me3, H3K27me1, and PolII but lack H3K27me3 enrichment.
Figure 6
Figure 6
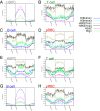
The chromatin environment of cell-specific potential enhancers (CSPEs) varies greatly during differentiation. (A) – (D) Chromatin profiles around size-normalized HSPC-specific CSPEs are displayed for (A) HSPCs, (B) T-cells, (C) B-cells, and (D) pRBCs. (E) – (H) Chromatin profiles around size-normalized B-cell-specific CSPEs are displayed for (E) HSPCs, (F) T-cells, (G) B-cells, and (H) pRBCs.
Figure 7
Figure 7
The presence of predicted enhancers and their chromatin environment both affect target gene expression. (A) Cell type-specific genes have significantly more CSPEs in the corresponding cell type. A CSPE is assigned to its nearest gene within +20kb or –20kb outside of the gene region and 500bp outside a promoter. The number of CSPEs from the corresponding cell type associated with cell type-specific genes (top) is significantly higher than the number of CSPEs associated with all genes with RPKM > 0 (bottom) in pRBCs (red), T-cells (green), and B-cells (blue). (B) Genes associated with CSPEs are significantly more highly expressed than predicted (All vs. CSPE p < 2.2 × 10⁻¹⁶). Potential target genes of CSPEs are sorted based on the chromatin environment at CSPEs or association with Brg1, PolII and p300 and their expression levels are compared to all genes. Significant differences are indicated by colored lines. See Additional file 1 for p-values and discussion.

References

    1. Till JE, McCulloch EA. A direct measurement of the radiation sensitivity of normal mouse bone marrow cells. Radiat Res. 1961;14:213–222. doi: 10.2307/3570892. - DOI - PubMed
    1. Freyssinier JM, Lecoq-Lafon C, Amsellem S, Picard F, Ducrocq R, Mayeux P, Lacombe C, Fichelson S. Purification, amplification and characterization of a population of human erythroid progenitors. Br J Haematol. 1999;106(4):912–922. doi: 10.1046/j.1365-2141.1999.01639.x. - DOI - PubMed
    1. Giarratana MC, Kobari L, Lapillonne H, Chalmers D, Kiger L, Cynober T, Marden MC, Wajcman H, Douay L. Ex vivo generation of fully mature human red blood cells from hematopoietic stem cells. Nat Biotechnol. 2005;23(1):69–74. doi: 10.1038/nbt1047. - DOI - PubMed
    1. Hattangadi SM, Wong P, Zhang L, Flygare J, Lodish HF. From stem cell to red cell: regulation of erythropoiesis at multiple levels by multiple proteins, RNAs, and chromatin modifications. Blood. 2011;118(24):6258–6268. doi: 10.1182/blood-2011-07-356006. - DOI - PMC - PubMed
    1. Kawamoto H, Ikawa T, Masuda K, Wada H, Katsura Y. A map for lineage restriction of progenitors during hematopoiesis: the essence of the myeloid-based model. Immunol Rev. 2010;238(1):23–36. doi: 10.1111/j.1600-065X.2010.00959.x. - DOI - PubMed

Publication types