. 2013:9:650.
doi: 10.1038/msb.2013.7.

Network balance via CRY signalling controls the Arabidopsis circadian clock over ambient temperatures

Affiliations

Network balance via CRY signalling controls the Arabidopsis circadian clock over ambient temperatures

Peter D Gould et al. Mol Syst Biol. 2013.

Abstract

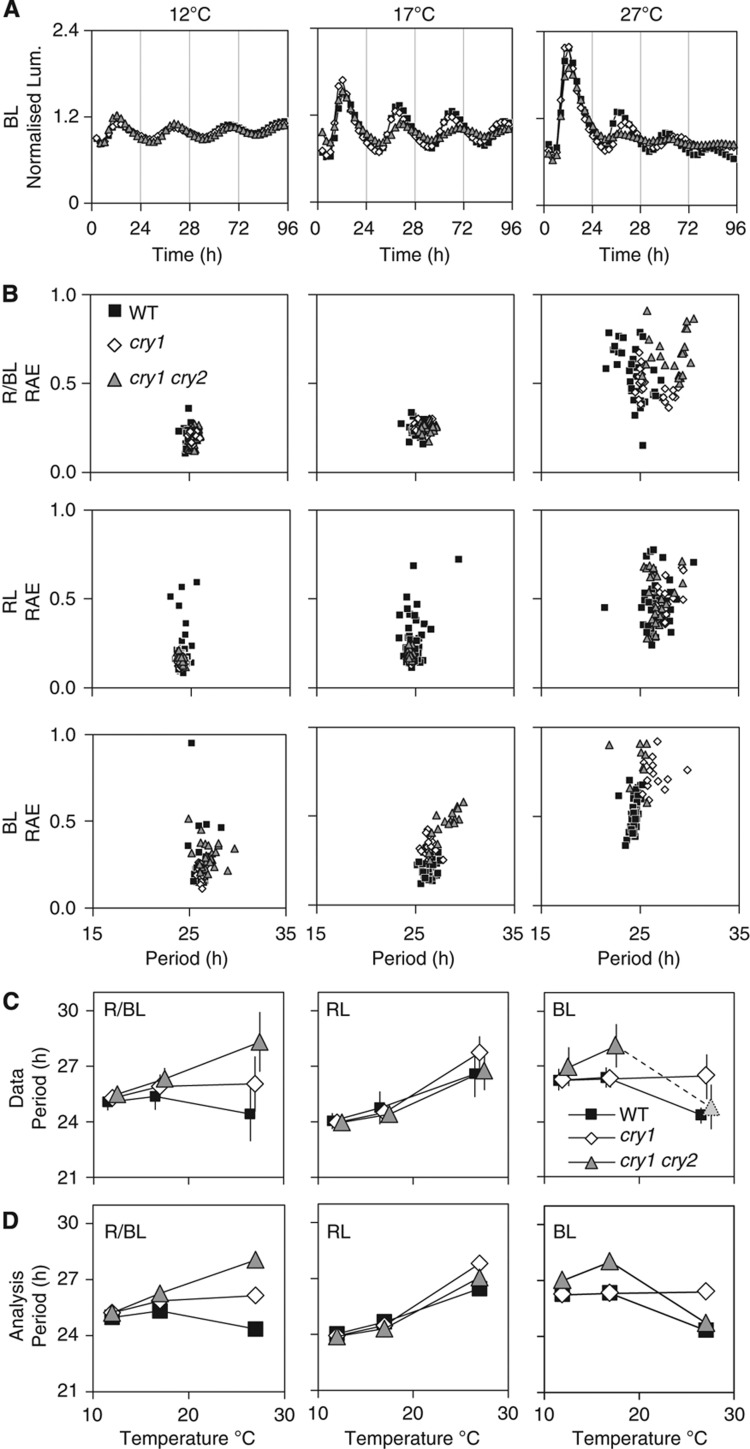
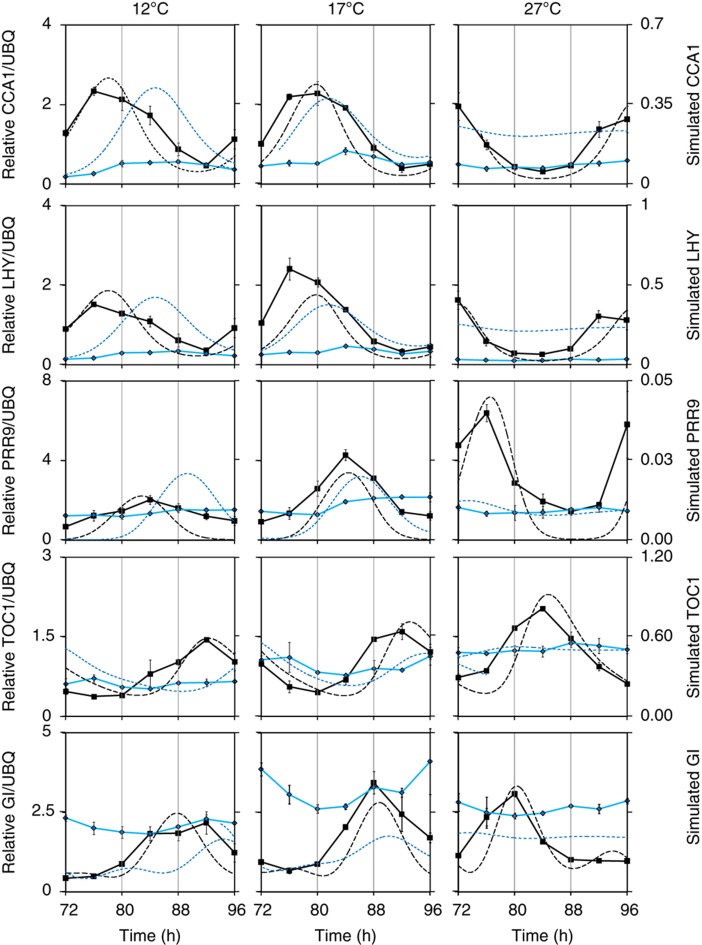
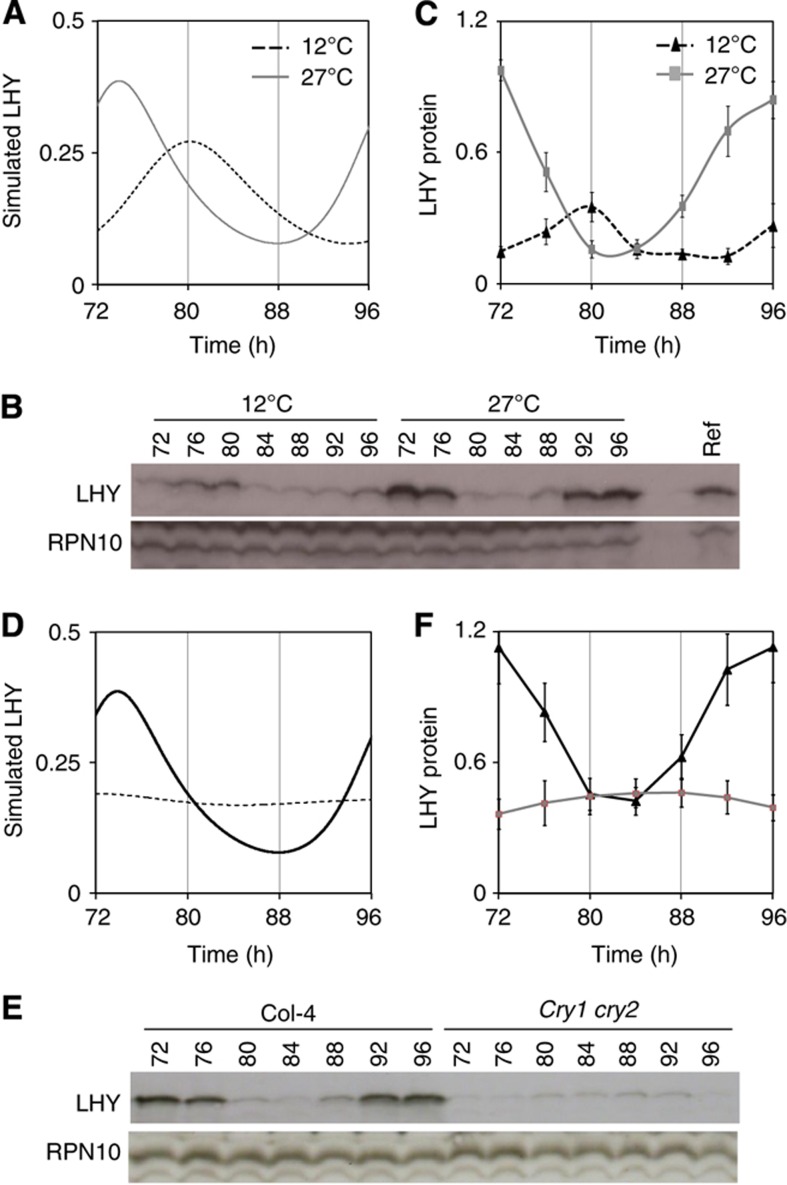
Circadian clocks exhibit 'temperature compensation', meaning that they show only small changes in period over a broad temperature range. Several clock genes have been implicated in the temperature-dependent control of period in Arabidopsis. We show that blue light is essential for this, suggesting that the effects of light and temperature interact or converge upon common targets in the circadian clock. Our data demonstrate that two cryptochrome photoreceptors differentially control circadian period and sustain rhythmicity across the physiological temperature range. In order to test the hypothesis that the targets of light regulation are sufficient to mediate temperature compensation, we constructed a temperature-compensated clock model by adding passive temperature effects into only the light-sensitive processes in the model. Remarkably, this model was not only capable of full temperature compensation and consistent with mRNA profiles across a temperature range, but also predicted the temperature-dependent change in the level of LATE ELONGATED HYPOCOTYL, a key clock protein. Our analysis provides a systems-level understanding of period control in the plant circadian oscillator.


Conflict of interest statement

The authors declare that they have no conflict of interest.

Figures

Figure 1
Figure 1
Light and temperature responses interact strongly to control circadian period. Transgenic Col-0 WT (black squares), cry1 mutant (white diamonds) and cry1 cry2 double mutant (grey triangles) seedlings carrying the CCR2:LUC reporter gene were entrained under 12L:12D cycles for 7 days, transferred at ZT 0 to 12, 17 or 27°C and imaged under constant BL, RL or R/BL. (A) Representative luminescence profiles for plants under BL at 12, 17 and 27°C. Each trace is normalised to the mean expression level over the entire time course, error bars indicate s.e. (B) Plot of the circadian period of luminescence in each seedling sample against its RAE, where low RAE values indicate robust rhythms. Each condition includes 16–50 samples, comprising of three independently transformed transgenic lines per genotype, tested in two to three independent experiments. (C) Arithmetic mean periods of the data in (B). The cry1 cry2 double mutant at 27°C is largely arrhythmic, denoted by a shaded symbol, though the average period of the weak remaining rhythms is close to WT. Markers are offset to show error bars (1 s.d.). (D) Mean periods from only the fixed effects of the mixed-effect statistical model (Supplementary Table 1), which capture the variation in the data.
Figure 2
Figure 2
Temperature-specific effects of cry photoreceptors on the expression profiles of clock genes are matched in the temperature-dependent model. Measured (solid lines, left axis) and simulated (dashed lines, right axis) mRNA expression profiles of clock genes in WT (black lines) and cry1 cry2 double-mutant plants (blue lines) under constant BL. Col-0 and cry1 cry2 seedlings were grown in 12L:12D entrainment conditions for 7 days before transferring at ZT0 to constant BL and 12, 17 or 27°C. Groups of seedlings were harvested every 4 h from 72–96 h after transfer. From each tissue, sample total RNA was extracted and assayed by qRT–PCR for the accumulation of CCA1, LHY, TOC1, GI and PRR9 relative to an internal UBIQUITIN10 (UBQ10) control. Plots represent average relative expression in each genotype for two biological replicates, error bars indicate s.e. Simulated mRNA expression profiles are shown for clock model components LHY/CCA1 (top two rows), PRR9, GI and TOC1 in the WT and cry1 cry2 double-mutant models under the same conditions. Simulated time series at 27°C were normalised to match the average level of the data at 27°C, because component levels in the model are arbitrary; the levels of simulated RNAs at 12 and 17°C follow from the model. As phase in LL is not well-defined, the time of peak simulated LHY/CCA1 was normalised to match the LHY data at 27°C; the timing of other simulated profiles follows from the model.
Figure 3
Figure 3
Predicted and observed temperature effects on LHY protein abundance. (A) Model simulation of LHY protein expression profiles at 12°C (black dotted line) and 27°C (grey line) in WT. (B) LHY protein levels from plant extracts assayed by western blotting. Col-0 seedlings were entrained under 12L:12D cycles for 7 days, before transferring at ZT0 to 12 or 27°C in constant BL. Plant tissue was harvested every 4 h from 72–96 h after transfer. From each tissue sample, total protein was extracted and assayed by western blotting for the accumulation of LHY protein. RPN10 was used as loading control. A reference sample (Ref., containing moderate levels of LHY protein) was loaded onto each blot to allow normalisation among blots. (C) Quantification of LHY protein levels. Mean LHY protein levels were determined from biological triplicate samples; error bars, 1 s.e.m. (D) Model simulation of LHY protein expression in the WT at 27°C (black line) and the cry1 cry2 double mutant (dotted line). (E) LHY protein levels from plant extracts assayed by western blotting. Treated as described in Figure 2F, for WT at 27°C and the cry1 cry2 mutant at 27°C. (F) Quantification of LHY protein level WT at 27°C (black line) and cry1 cry2 mutant at 27°C (grey line). Protein levels were determined from triplicates, error bars, 1 s.e.m.

References

    1. Akman OE, Locke JCW, Tang S, Carré I, Millar AJ, Rand DA (2008) Isoform switching facilitates period control in the Neurospora crassa circadian clock. Mol Syst Biol 4: 164. - PMC - PubMed
    1. Anderson C, Wilkins M (1989) Control of the circadian-rhythm of carbon-dioxide assimilation in Bryophyllum leaves by exposure to darkness and high-carbon dioxide concentrations. Planta 177: 401–408 - PubMed
    1. Bates DM, Maechler M (2011) lme4: Linear Mixed-effects Models Using S4 Classes. R package version 0 999375–37/r1160
    1. Baudry A, Ito S, Song YH, Strait AA, Kiba T, Lu S, Henriques R, Pruneda-Paz JL, Chua NH, Tobin EM, Kay SA, Imaizumi T (2010) F-box proteins FKF1 and LKP2 act in concert with ZEITLUPE to control Arabidopsis clock progression. Plant Cell 22: 606–622 - PMC - PubMed
    1. Brettschneider C, Rose RJ, Hertel S, Axmann IM, Heck AJR, Kollmann M (2010) A sequestration feedback determines dynamics and temperature entrainment of the KaiABC circadian clock. Mol Syst Biol 6: 389. - PMC - PubMed

Publication types