. 2013:4:1615.
doi: 10.1038/ncomms2620.

Impact of macromolecular crowding on DNA replication

Affiliations

Impact of macromolecular crowding on DNA replication

Barak Akabayov et al. Nat Commun. 2013.

Abstract

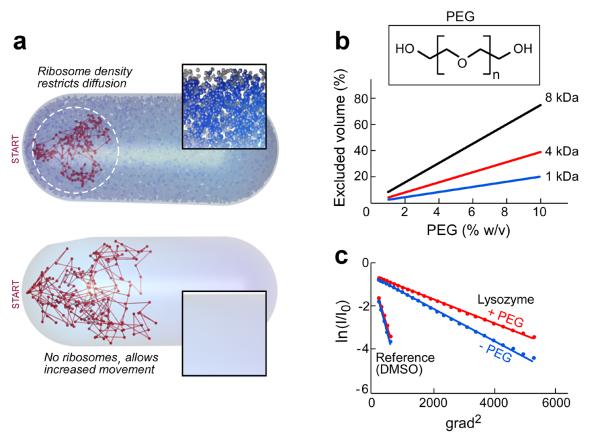
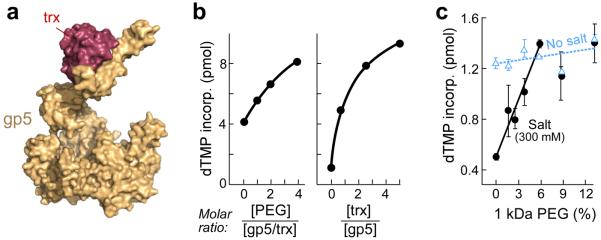
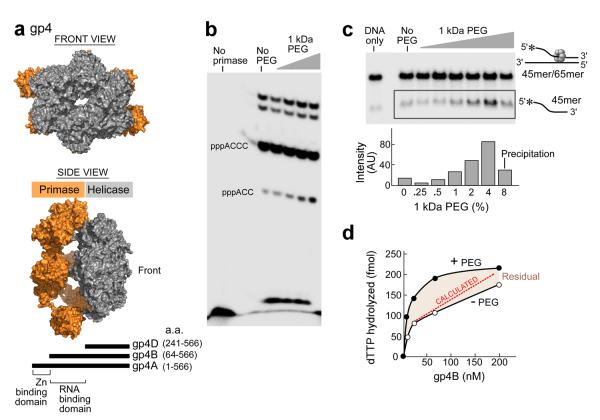
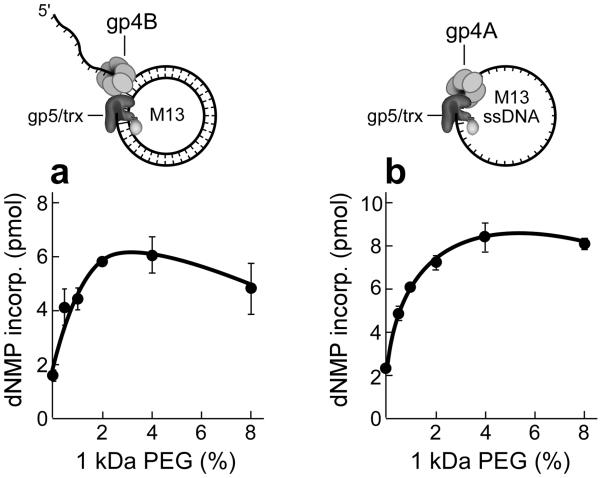
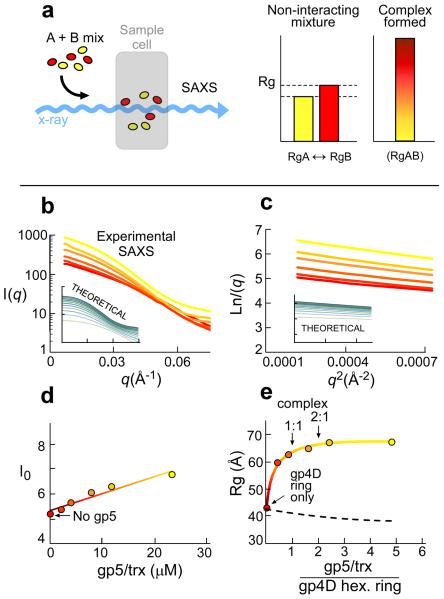
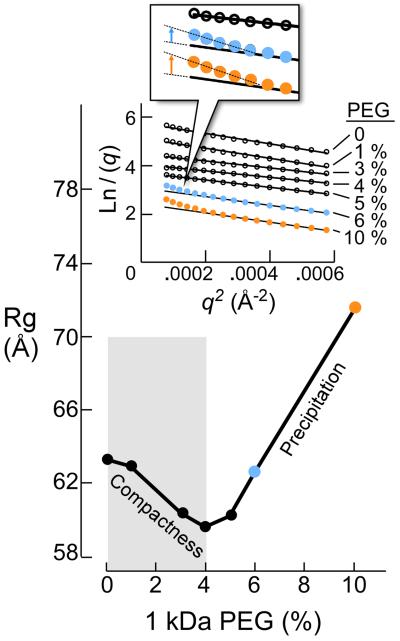
Enzymatic activities in vivo occur in a crowded environment composed of many macromolecules. This environment influences DNA replication by increasing the concentration of the constituents, desolvation, decreasing the degrees of freedom for diffusion and hopping of proteins onto DNA, and enhancing binding equilibria and catalysis. However, the effect of macromolecular crowding on protein structure is poorly understood. Here we examine macromolecular crowding using the replication system of bacteriophage T7 and we show that it affects several aspects of DNA replication; the activity of DNA helicase increases and the sensitivity of DNA polymerase to salt is reduced. We also demonstrate, using small-angle X-ray scattering analysis, that the complex between DNA helicase and DNA polymerase/trx is far more compact in a crowded environment. The highest enzymatic activity corresponds to the most compact structure. Better knowledge of the effect of crowding on structure and activity will enhance mechanistic insight beyond information obtained from NMR and X-ray structures.


Figures

Figure 1
Figure 1. Effects of macromolecular crowding
(a) Random walk in a crowded environment. Simulation for random walk (red) of a 30 kDa protein in the presence (upper panel) or absence (bottom panel) of 18,000 ribosomes as crowding agents in a volume of an E. coli cell. The simulation was based on the calculation of diffusion coefficient using the D=(kB T)/3πηd where kBT is scaling factor of Boltzmann constant and the temperature, η is a viscosity value for the interior of an E. coli cell = 3.5*10−3 Kg/m/sec, d the diameter of the particle used in the simulation = 30 Å. The average displacement was computed as follows: A = 2*R*D*τ, where τ is the interval for displacement= 0.0001 sec and R is the dimensions = 3. (b) Calculation of the volume that PEG of different sizes (1, 4, and 8 kDa) occupies at different concentrations. At 4% (40 mg/ml) PEG 1 kDa occupies 8% of the volume in a test tube; 4% PEG 1 kDa provides the approximate crowding effect found in vivo. (c) Translational diffusion of 1mM lysozyme in the presence or the absence of 4% PEG 1 kDa determined using DOSY-NMR. The logarithm of the relative intensity is plotted against the square of the gradient strength ranging from 15 to 80 G/cm. The decrease in magnetization with increasing gradient strength was analyzed using the equation : II0=eD(Δδ3)q2 where D is the diffusion coefficient with D=kBT6πηFrS, kB is the Boltzmann constant, T the temperature, η the viscosity, F the dimensionless Perrin factor, rS the hydrodynamic radius of the molecule q = γδg, Δ = 150 ms (separation of the gradient echo), δ = 2.5 ms (gradient duration), γ the gyromagnetic ratio of the nucleus and g the strength of the gradient (ranging from 15 to 80 G/cm. Thirty two points were recorded in the indirect dimension. DMSO was used as an internal reference.
Figure 2
Figure 2. Gp5/trx polymerase activity and macromolecular crowding
(a) T7 DNA polymerase (gp5, yellow) bound to its processivity factor E. coli thioredoxin (trx, red) polymerizes nucleotides continuously on the leading strand. The crystal structure of gp5/trx bound to primer template and an incoming nucleotide (PDB id code: 1t8e) in a view from the side. The figure was created using PyMOL (http://www.pymol.org). (b) Polymerase activity of gp5 with increasing amounts of trx (right). The activity was measured in a standard reaction containing 40 mM Tris–HCl (pH 7.5), 10 mM MgCl2, 10 mM DTT, 50 mM potassium glutamate, 0.25 mM dATP, dCTP, dGTP, and [α–32P] dTTP, 20 nM primed M13 DNA, 20 nM gp5, and the indicated amount of trx. After incubation at 37 °C for 10 min the amount of [α–32P] dTMP incorporated into DNA was measured. Increased polymerase activity of gp5 and trx premixed in a ration of 1:1 is observed as the content of PEG is increased (left). (c) Effect of macromolecular crowding by PEG on polymerase activity of gp5/trx in the presence or the absence of salt. Polymerase activity was measured under similar buffer conditions as in (a). Gp5 (5 nM) was mixed with trx (25 nM) in the presence of 300 mM NaCl (black) or in absence of NaCl (cyan). The error bars were derived from three independent experiments.
Figure 3
Figure 3. The effect of macromolecular crowding on gp4 activity
(a) Front (top panel) and side View (middle panel)of a gp4 model. Gp4 has both primase and helicase activities in the same polypeptide chain. Subunits of the heptameric crystal structure of gp4B (PDB entry 1q57) were aligned with the hexameric helicase fragment (PDB ID code: 1e0k) and primase fragment (PDB entry 1nui) of gp4. Schematic representation of gp4 constructs (bottom). The boundaries for the helicase and primase domains of gp4 are depicted. The three constructs containing the C-terminal helicase domain of gp4 are denoted as gp4A, B, and D. Residue numbers are as indicated. The figure was created using PyMOL (http://www.pymol.org). (b) Effect of PEG on oligonucleotide synthesis by primase fragment. The standard reaction contained the oligonucleotide 5'-GGGTCA10-3' containing the primase recognition sequence, 200 μM [α-32P]-CTP and ATP, and increasing amounts of 1kDa PEG (0, 1.25, 2.5, 5, 10%) in a buffer containing 40 mM Tris-HCl (pH 7.5), 10 mM MnCl2, 10 mM DTT, and 50 mM potassium glutamate. The quenched samples were loaded onto 25% polyacrylamide sequencing gel containing 3 M urea and visualized using autoradiography. (c) Effect of PEG on the DNA unwinding activity of gp4B. The DNA fork depicted (right) was prepared by partially annealing a 5'–32P labeled 45-mer oligonucleotide to a 65-mer oligonucleotide. DNA unwinding activity was performed in a standard reaction containing 40 mM Tris–HCl (pH 7.5), 50 mM potassium glutamate, increasing amounts of PEG 1 kDa (0, 0.25, 0.5, 1, 2, 4 and 8%), and 400 nM of gp4B. The gel shows the separation of unwound ssDNA (bottom) from the dsDNA substrate in a 10% non-denaturing gel. (d) Effect of highly crowding conditions (8% PEG) on the DNA-dependent dTTPase activity of gp4B. The dTTPase activity was measured in the presence of 5 mM dTTP and 8% PEG and with various concentrations of gp4B (0–200 nM). Difference in the dTTPase activity in the presence and absence of high concentration of PEG is denoted as residual.
Figure 4
Figure 4. The effect of macromolecular crowding on gp5/trx and gp4 interactions
The three proteins move the replication fork at a rate of approximately 150 nt/sec at 25 degrees. The bifunctional gene 4 helicase-primase (gp4) assembles on the lagging-strand as a hexamer where it forms a complex with gp5/trx and unwinds the DNA duplex. (a) Effect of PEG on strand-displacement DNA synthesis mediated by gp5/trx and gene 4 helicase (gp4B). Using M13 dsDNA with a 5' ssDNA tail (top), the efficiency of strand-displacement DNA synthesis in the presence of PEG was determined. The standard reaction contained the dsM13 template (10 nM), 0.3 mM dATP, dGTP, dCTP and [α–32P] dTTP (0.1 μCi), 10 nM gp5/trx, 200 nM monomeric concentrations of gp4B, and increasing amounts of PEG 1 kDa (0–8%). After incubation for 30 min at 37 °C and the amount of DNA synthesis was determined by the amount of [α–32P] dTTP incorporated into DNA. (b) Primase-dependent DNA synthesis. The reaction was similar to (a) except that gp4A replaced gp4B and 10 nM M13 ssDNA replaced the dsM13 DNA. The reaction buffer also contained ATP and CTP (100 μM each). The amounts of primase-dependent DNA synthesis was determined by measuring the incorporation of [32P] dTMP into DNA. The error bars were derived from three independent experiments.
Figure 5
Figure 5. SAXS reconstitution assay of the gp5/trx/gp4D complex
(a) Schematic view of the experimental design. Samples containing proteins A and B are premixed in various ratios and placed in the sample cell. Rg values were extracted from the SAXS data. Increased Rg values indicate that a higher order specie is formed. Intermediate Rg value from the individual proteins in the mixture is indicative of non-interacting species. (b–c) Small angle X–Ray scattering (SAXS) curves of hexameric gp4D (5 μM) premixed with increasing amounts of gp5/trx (0, 2, 4, 8, 12, 24 μM). Raw SAXS data (b) and the corresponding Guinier plots (c) for every sample. Colors indicate a gradual increase in the gp5/trx concentration (red to yellow). (c) The Rg values for the complex formed derived from these data and determined using Guinier plots. The insets in both (b) and (c) represent the theoretical SAXS curves of linearly combined spectra (from the available crystal structures) of the putative complex and the free proteins in solution. The data represent a complex between gp4D and gp5/trx in a molar ratio of 1:2, respectively. The theoretical SAXS curves of gp4D bound to gp5trx in a molar ratio of 1:1, 1:2, 1:3, and 1:4, respectively, are presented in Supplementary Figure S4. (d) Scattering intensities (I0) shown as a function of concentration of gp5/trx. Data presents scattering at zero angle of gp4D (5 μM) and increasing amounts of gp5/trx (0–24 μM), corresponding to the amount of electron scatterers at any sample. (e) SAXS results plotting the radius of gyration (Rg) against gp5/trx and gp4D ratios. Experimental SAXS data were collected for gp4D (5 μM) and increasing amounts of gp5/trx (0–24 μM) in a buffer containing 20 mM Tris–HCl (pH 7.5), 50 mM potassium glutamate, and 2 mM DTT. Gp4D was premixed with 6.6 μM 15mer ssDNA and 0.5 mM β, γ methylene dTTP to form hexameric molecules. Radius of gyration serves as an indicator for the formation of higher-order protein complexes. The dashed line represents a theoretical curve of Rg values that would be obtained if the components did not interact.
Figure 6
Figure 6. The effect of PEG 1kDa on the Rg of gp4D bound to gp5/trx
The sample contained 4.5 μM gp4D (hexamer) premixed with 6.6 μM 15-mer ssDNA, 0.5 mM β, γ methylene dTTP and 5 μM gp5/trx. The reaction buffer contained 20 mM Tris-HCl (pH 7.5), 50 mM potassium glutamate, 2mM DTT, and increasing amounts of PEG 1 k (0–10%). The Rg values for the samples were derived from the SAXS data and determined using Guinier plots. SAXS Guinier plots at high PEG concentrations are presented in the inset.

References

    1. Zimmerman SB, Minton AP. Macromolecular crowding: biochemical, biophysical, and physiological consequences. Annu. Rev. Biophys. Biomol. Struct. 1993;22:27–65. - PubMed
    1. Zimmerman SB, Trach SO. Estimation of macromolecule concentrations and excluded volume effects for the cytoplasm of Escherichia coli. J. Mol. Biol. 1991;222:599–620. - PubMed
    1. Minton AP. How can biochemical reactions within cells differ from those in test tubes? J. Cell Sci. 2006;119:2863–9. - PubMed
    1. Ogston AG, Phelps CF. Exclusion of inulin from solutions of hyaluronic acid. Nature. 1960;187:1024. - PubMed
    1. Minton AP. Effect of a concentrated “inert” macromolecular cosolute on the stability of a globular protein with respect to denaturation by heat and by chaotropes: a statistical-thermodynamic model. Biophys. J. 2000;78:101–9. - PMC - PubMed

Publication types