

Lipid overloading during liver regeneration causes delayed hepatocyte DNA replication by increasing ER stress in mice with simple hepatic steatosis
- PMID: 23512345
- PMCID: PMC3925298
- DOI: 10.1007/s00535-013-0780-7
Lipid overloading during liver regeneration causes delayed hepatocyte DNA replication by increasing ER stress in mice with simple hepatic steatosis
Abstract
Background and aim: Impaired fatty liver regeneration has already been reported in many genetic modification models. However, in diet-induced simple hepatic steatosis, which showed similar phenotype with clinical pathology, whether liver regeneration is impaired or not remains unclear. In this study, we evaluated liver regeneration in mice with diet-induced simple hepatic steatosis, and focused on excess lipid accumulation occurring during liver regeneration.
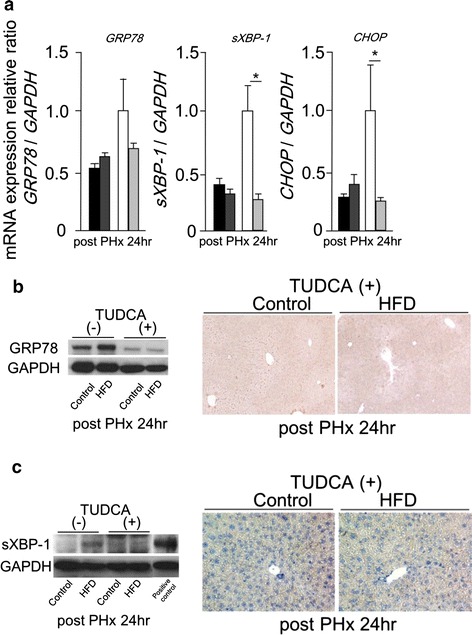
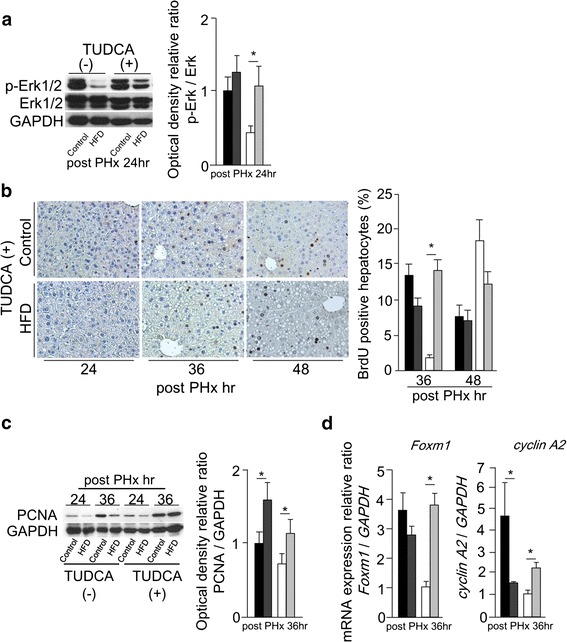
Methods: Mice were fed high fat diet (HFD) or control diet for 9-10 weeks. We analyzed intrahepatic lipid accumulation, DNA replication, and various signaling pathways including cell proliferation and ER stress during liver regeneration after partial hepatectomy. In addition, some of mice were pretreated with tauroursodeoxycholic acid (TUDCA), a chemical chaperone which alleviates ER stress, and then we estimated TUDCA effects on liver regeneration.
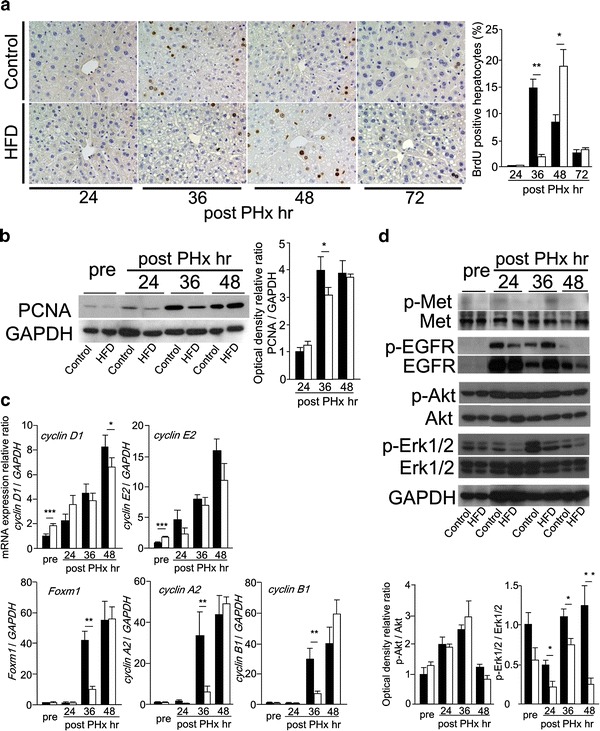
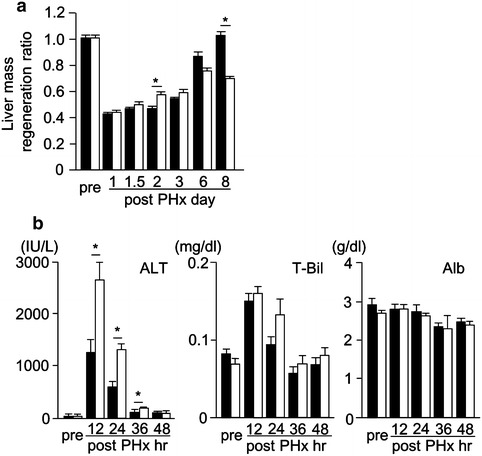
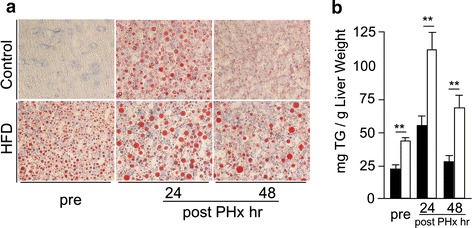
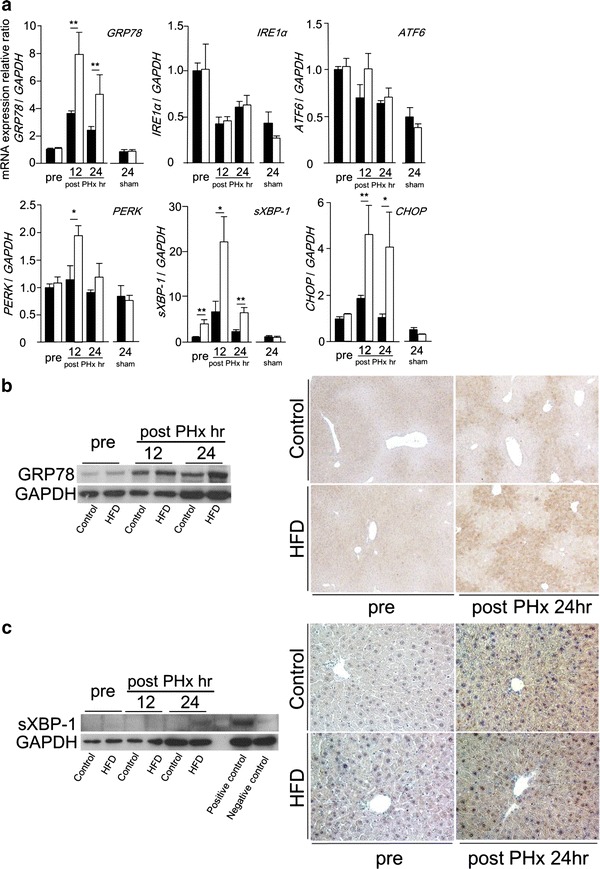
Results: The peak of hepatocyte BrdU incorporation, the expression of proliferation cell nuclear antigen (PCNA) protein, and the expressions of cell cycle-related genes were observed in delayed time in HFD mice. The expression of phosphorylated Erk1/2 was also delayed in HFD mice. The amounts of liver triglyceride were at least twofold higher in HFD mice at each time point. Intrahepatic palmitic acid was increased especially in HFD mice. ER stress induced during liver regeneration was significantly higher in HFD mice. In HFD mice, pretreatment with TUDCA reduced ER stress and resulted in improvement of delayed liver regeneration.
Conclusion: In simple hepatic steatosis, lipid overloading occurring during liver regeneration might be caused ER stress and results in delayed hepatocyte DNA replication.
Figures
Similar articles
-
SIRT1/HSF1/HSP pathway is essential for exenatide-alleviated, lipid-induced hepatic endoplasmic reticulum stress.Hepatology. 2017 Sep;66(3):809-824. doi: 10.1002/hep.29238. Epub 2017 Jul 20. Hepatology. 2017. PMID: 28439947
-
Fatty acid-induced endoplasmic reticulum stress promoted lipid accumulation in calf hepatocytes, and endoplasmic reticulum stress existed in the liver of severe fatty liver cows.J Dairy Sci. 2019 Aug;102(8):7359-7370. doi: 10.3168/jds.2018-16015. Epub 2019 May 31. J Dairy Sci. 2019. PMID: 31155263
-
Hepatocyte-specific deletion of farnesoid X receptor delays but does not inhibit liver regeneration after partial hepatectomy in mice.Hepatology. 2012 Dec;56(6):2344-52. doi: 10.1002/hep.25918. Hepatology. 2012. PMID: 22730081 Free PMC article.
-
The Role of Endoplasmic Reticulum Stress Response in Liver Regeneration.Semin Liver Dis. 2023 Aug;43(3):279-292. doi: 10.1055/a-2129-8977. Epub 2023 Jul 14. Semin Liver Dis. 2023. PMID: 37451282 Free PMC article. Review.
-
Steatosis as a risk factor in liver surgery.Ann Surg. 2007 Jan;245(1):20-30. doi: 10.1097/01.sla.0000225113.88433.cf. Ann Surg. 2007. PMID: 17197961 Free PMC article. Review.
Cited by
-
Loss of Ufl1/Ufbp1 in hepatocytes promotes liver pathological damage and carcinogenesis through activating mTOR signaling.J Exp Clin Cancer Res. 2023 May 3;42(1):110. doi: 10.1186/s13046-023-02681-6. J Exp Clin Cancer Res. 2023. PMID: 37131258 Free PMC article.
-
Somatic genome editing with CRISPR/Cas9 generates and corrects a metabolic disease.Sci Rep. 2017 Mar 16;7:44624. doi: 10.1038/srep44624. Sci Rep. 2017. PMID: 28300165 Free PMC article.
-
Liver-specific Repin1 deficiency impairs transient hepatic steatosis in liver regeneration.Sci Rep. 2018 Nov 15;8(1):16858. doi: 10.1038/s41598-018-35325-3. Sci Rep. 2018. PMID: 30442920 Free PMC article.
-
Foie gras and liver regeneration: a fat dilemma.Cell Stress. 2018 Jun 14;2(7):162-175. doi: 10.15698/cst2018.07.144. Cell Stress. 2018. PMID: 31225483 Free PMC article. Review.
-
The Effect of Estrogen on Hepatic Fat Accumulation during Early Phase of Liver Regeneration after Partial Hepatectomy in Rats.Acta Histochem Cytochem. 2019 Aug 30;52(4):67-75. doi: 10.1267/ahc.19018. Epub 2019 Aug 27. Acta Histochem Cytochem. 2019. PMID: 31592200 Free PMC article.
References
MeSH terms
Substances
LinkOut - more resources
Full Text Sources
Other Literature Sources
Miscellaneous
