. 2013 May;83(5):483-94.
doi: 10.1002/cyto.a.22271. Epub 2013 Mar 19.

Normalization of mass cytometry data with bead standards

Affiliations

Normalization of mass cytometry data with bead standards

Rachel Finck et al. Cytometry A. 2013 May.

Abstract

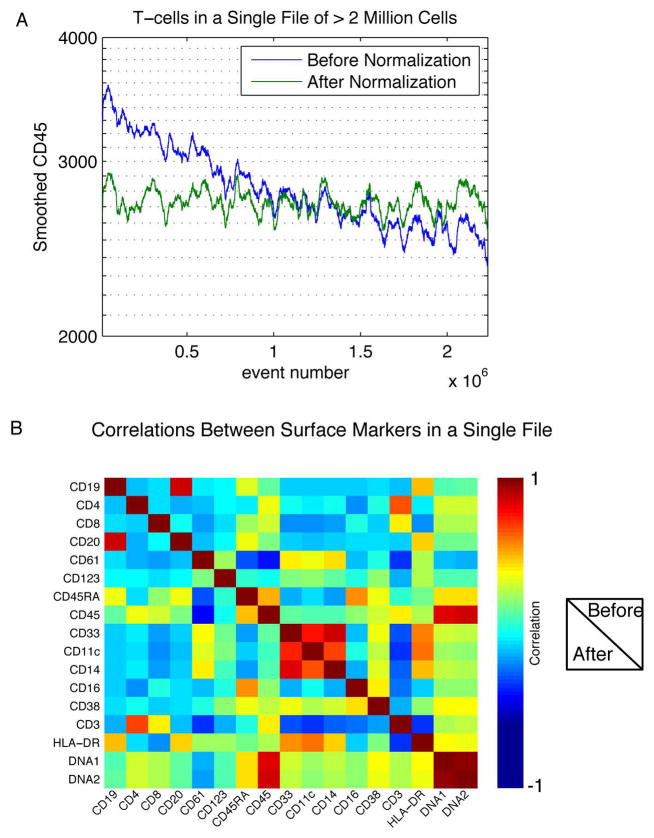
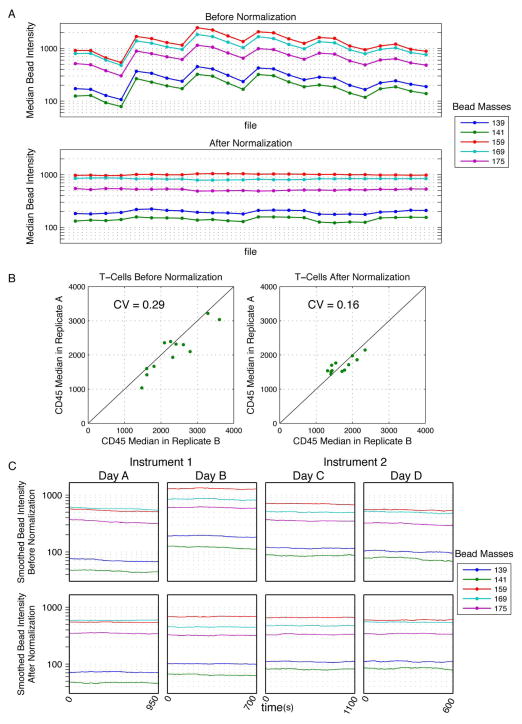
Mass cytometry uses atomic mass spectrometry combined with isotopically pure reporter elements to currently measure as many as 40 parameters per single cell. As with any quantitative technology, there is a fundamental need for quality assurance and normalization protocols. In the case of mass cytometry, the signal variation over time due to changes in instrument performance combined with intervals between scheduled maintenance must be accounted for and then normalized. Here, samples were mixed with polystyrene beads embedded with metal lanthanides, allowing monitoring of mass cytometry instrument performance over multiple days of data acquisition. The protocol described here includes simultaneous measurements of beads and cells on the mass cytometer, subsequent extraction of the bead-based signature, and the application of an algorithm enabling correction of both short- and long-term signal fluctuations. The variation in the intensity of the beads that remains after normalization may also be used to determine data quality. Application of the algorithm to a one-month longitudinal analysis of a human peripheral blood sample reduced the range of median signal fluctuation from 4.9-fold to 1.3-fold.


Figures

Figure 1
Figure 1. Bead singlet identification
(A) Beads were identified by manually drawing liberal gates on biaxial plots of DNA by each of the five bead channels, shown in yellow. Events falling in the intersection of the five gates were labeled as beads and colored in blue. As seen in the close-up of the Lu175 plot, some events fall inside single gates but are eliminated because they are not present in the intersection of all five gates. The bead gating was done for each file separately. (B) Biaxial plots of DNA by the Tm169 bead channel in files using 1x and 10x of the standard bead concentrations, respectively, with histogram close-ups of the beads events within those files. Bead-bead doublets can be seen in the higher concentration, and cell-bead doublets are present in both.
Figure 2
Figure 2. Bead smoothing and normalization
(A) The raw intensities of the bead events in all of the bead channels were plotted over time for four files acquired on different days. (B) Smoothed intensity values were calculated by computing the median intensities across a sliding window of 500 beads. The smoothed intensities of the bead events in all of the bead channels were then plotted over time in the four files. Between collection of data files 3 and 4 the instrument was cleaned and tuned (yellow arrow), which resulted a shift in the relative bead intensities. (C) At each time-point in the smoothed data, the slope of the line through the origin was determined by minimizing the sum of the squared error between the bead intensities at that time point and the mean smoothed bead intensities across the experiment. The fits at three time points are shown. (D) The fitted slopes for all time points across the experiment. (E) The raw bead intensities were multiplied by the fitted slopes at each time point and then re-smoothed and plotted.
Figure 3
Figure 3. Selecting biological signals for validation of bead-based normalization
(A) Human PBMC from a single healthy donor was stained with a panel of 14 antibodies against surface antigens, then measured repeatedly by mass cytometry on different days over a period of 1 month. The data was gated manually to identify 8 distinct immune subpopulations representing different levels of homogeneously expressed “positive” markers. The gate locations were tailored to each file separately; a representative file is shown. (B) The intensities of surface markers positive in each gated population were smoothed by computing the local medians in equal-sized event number windows and were then plotted over time. (C) The smoothed surface marker values at a given time point were compared to their means. Values are plotted here for three time points against the lines computed from the beads closest in time. The R2 values of the markers with respect to the bead lines are shown.
Figure 4
Figure 4. Distributions of surface markers before and after bead normalization
Density estimates of selected markers in various populations before and after bead normalization in the same sample measured on four different days. Binary gates (dotted lines) were manually tailored to each of the four files separately before normalization, and global gates were drawn after normalization. The percentages of the cells in the positive gates are shown.
Figure 5
Figure 5. Normalization stabilizes surface marker intensities over time and maintains multivariate correlations between markers
(A) A sample of > 2 million cells was measured in a single acquisition acquired over a period of >2 hours. The smoothed CD45 intensity of CD3+ cells is shown before and after bead normalization. (B) The pairwise correlations between cell surface markers in a single file were calculated and displayed here as a heatmap. The correlations before and after normalization are shown in the upper-right and lower-left triangles of the plot, respectively. The values on the diagonal are the correlations between a single parameter with itself before and after normalization.
Figure 6
Figure 6. Normalization of data spanning multiple days and instruments
(A) Pediatric leukemia bone marrow samples (n = 12) were measured with 2 antibody staining panels, totaling 24 .fcs files collected over 6 days. Median intensities of bead events extracted from each file were plotted before and after normalization (each point represents one file). (B) Gated CD3+ T cells from each staining panel (Panel A and Panel B) were used as technical replicates to illustrate the improved consistency after normalization. The median CD45 values for T cells from each staining panel were plotted against each other for each of the 12 samples, before and after normalization. The R2 values of the data as compared to a line of equality are shown. (C) Metal-embedded beads were acquired on two different days and two different instruments. Bead intensities were smoothed as described and, are plotted over time.

Comment in

References

    1. Bandura DR, et al. Mass Cytometry: Technique for Real Time Single Cell Multitarget Immunoassay Based on Inductively Coupled Plasma Time-of-Flight Mass Spectrometry. Anal Chem. 2009 - PubMed
    1. Bendall SC, et al. Single-cell mass cytometry of differential immune and drug responses across a human hematopoietic continuum. Science. 2011;332(6030):687–96. - PMC - PubMed
    1. Hahne F, et al. Per-channel basis normalization methods for flow cytometry data. Cytometry. Part A: the journal of the International Society for Analytical Cytology. 2010;77(2):121–31. - PMC - PubMed
    1. Perfetto SP, et al. Quality assurance for polychromatic flow cytometry. Nature protocols. 2006;1(3):1522–30. - PubMed
    1. Dendrou CA, et al. Fluorescence intensity normalisation: correcting for time effects in large-scale flow cytometric analysis. Advances in bioinformatics. 2009:476106. - PMC - PubMed

Publication types