. 2013 Mar 15;27(6):670-82.
doi: 10.1101/gad.210427.112.

Inflammation and Hras signaling control epithelial-mesenchymal transition during skin tumor progression

Affiliations

Inflammation and Hras signaling control epithelial-mesenchymal transition during skin tumor progression

Christine E Wong et al. Genes Dev. .

Abstract

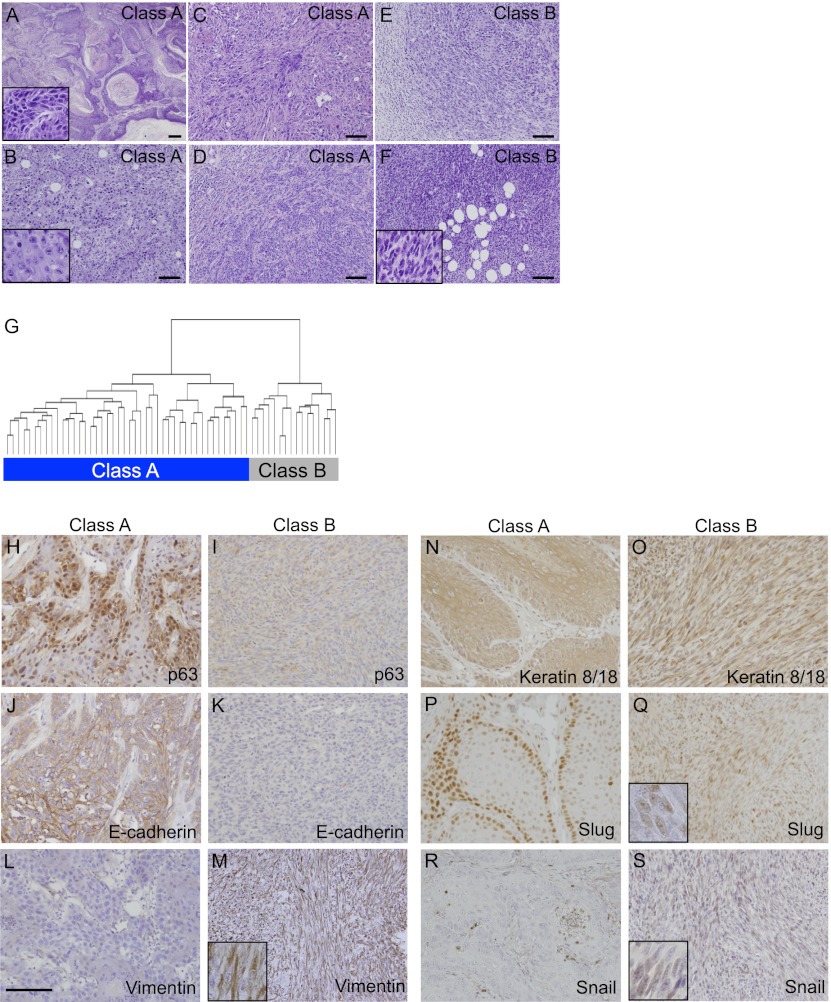
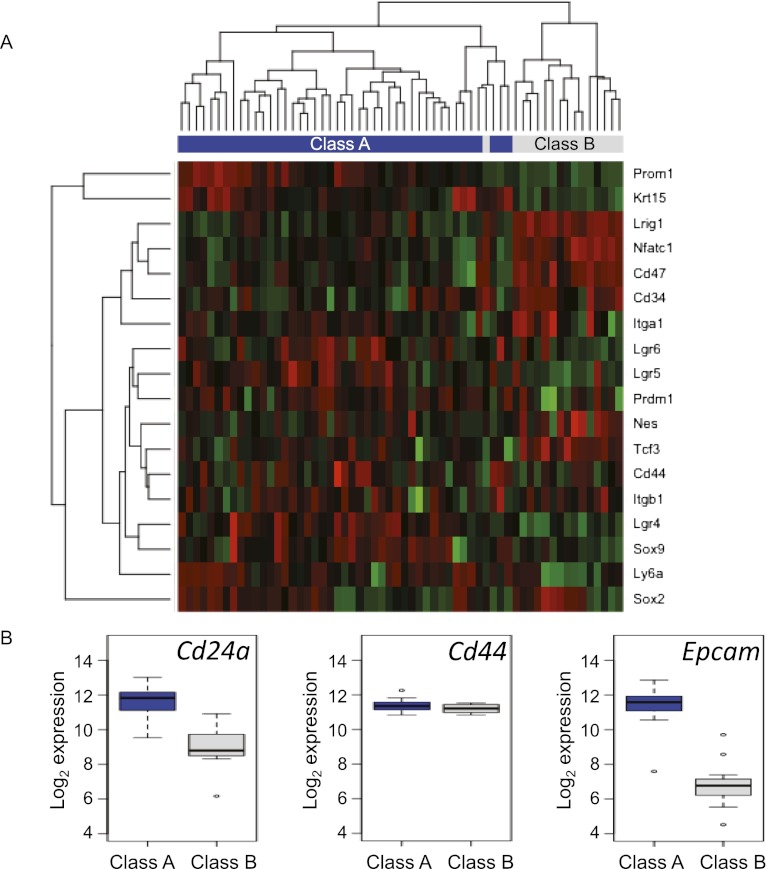
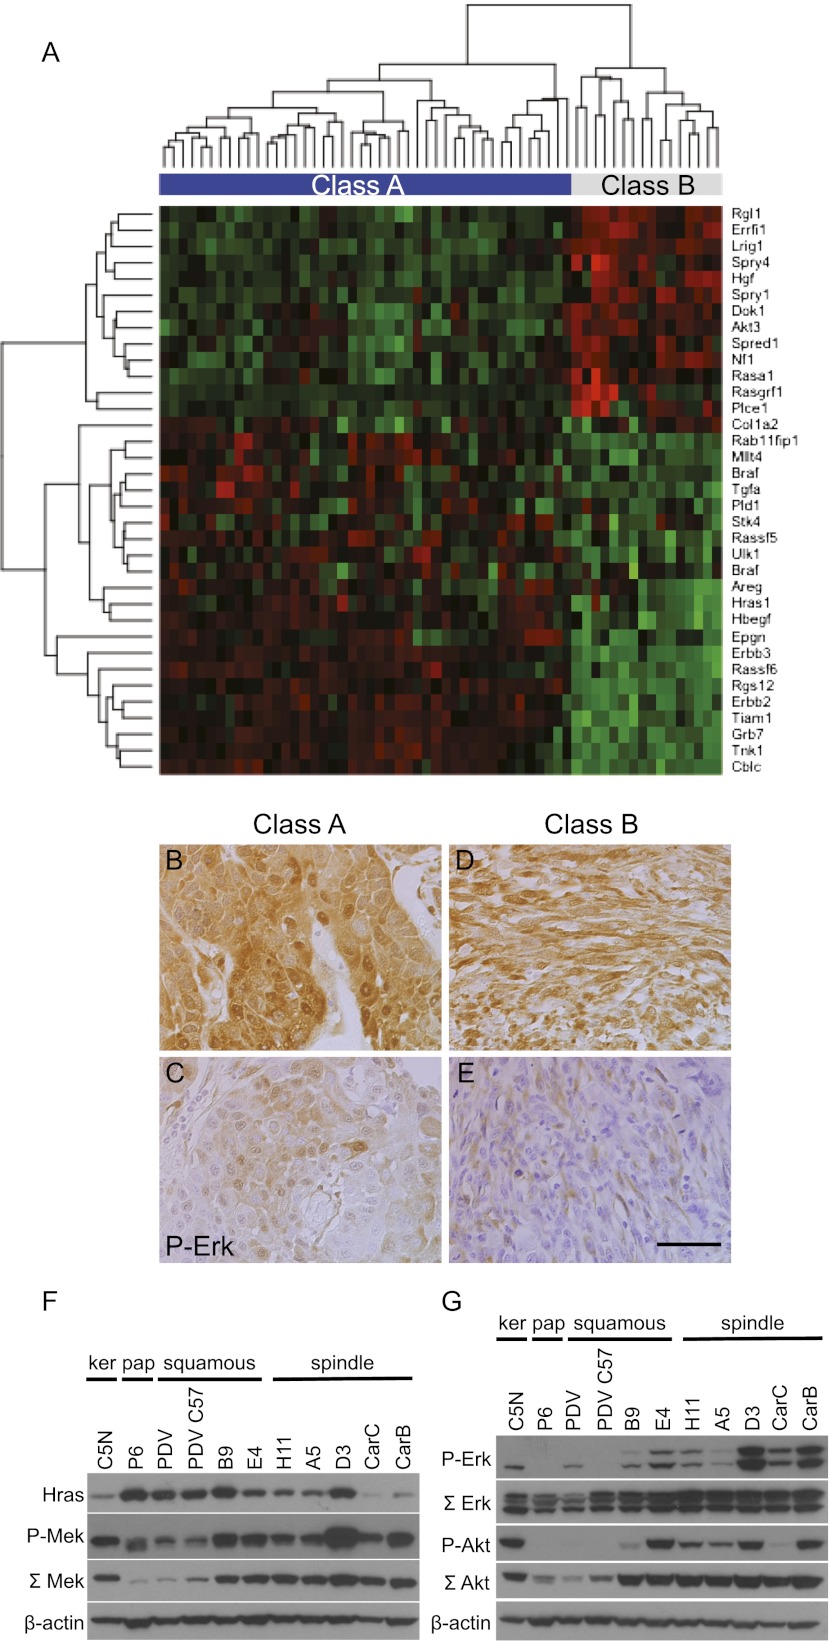
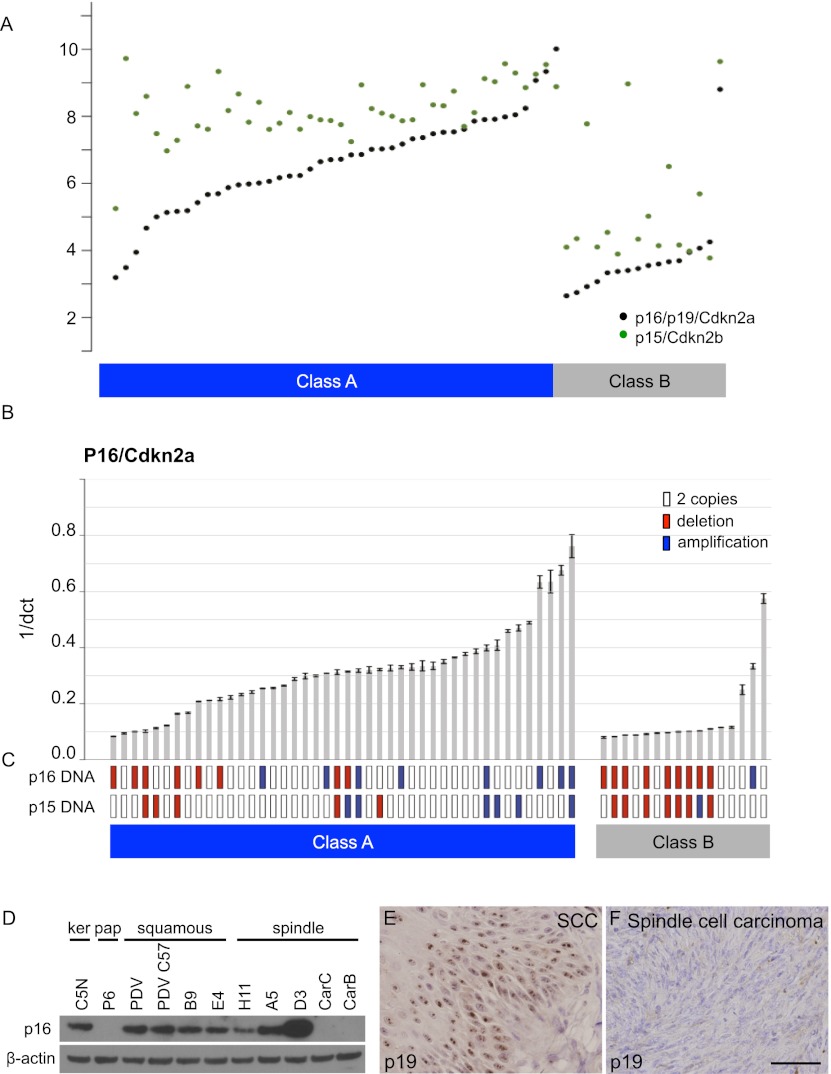
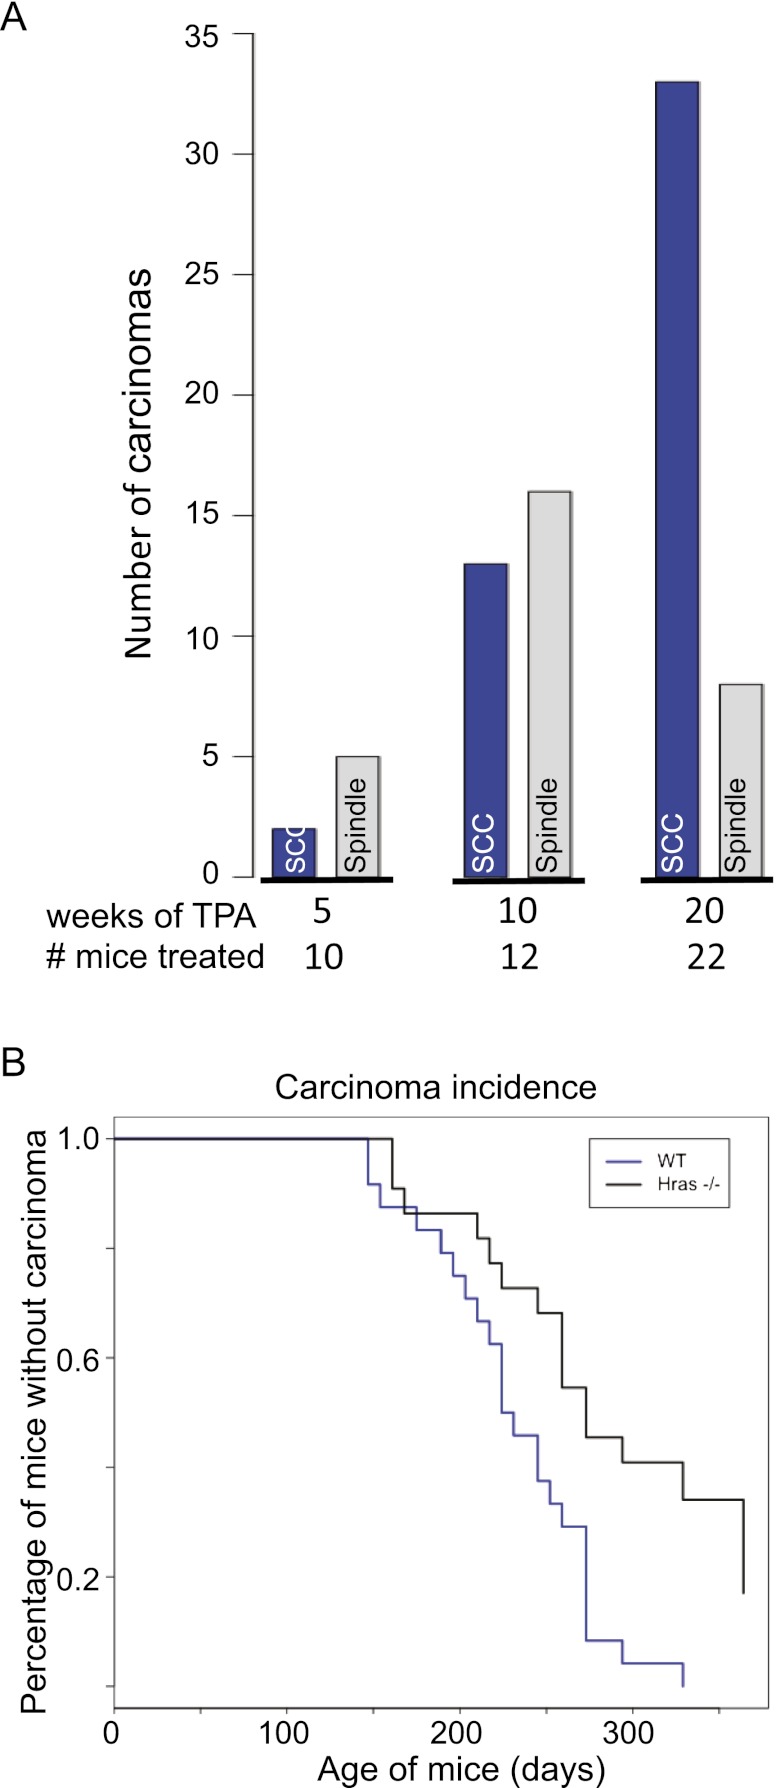
Epithelial-mesenchymal transition (EMT) is thought to be an important, possibly essential, component of the process of tumor dissemination and metastasis. About 20%-30% of Hras mutant mouse skin carcinomas induced by chemical initiation/promotion protocols have undergone EMT. Reduced exposure to TPA-induced chronic inflammation causes a dramatic reduction in classical papillomas and squamous cell carcinomas (SCCs), but the mice still develop highly invasive carcinomas with EMT properties, reduced levels of Hras and Egfr signaling, and frequent Ink4/Arf deletions. Deletion of Hras from the mouse germline also leads to a strong reduction in squamous tumor development, but tumors now acquire activating Kras mutations and exhibit more aggressive metastatic properties. We propose that invasive carcinomas can arise by different genetic and biological routes dependent on exposure to chronic inflammation and possibly from different target cell populations within the skin. Our data have implications for the use of inhibitors of inflammation or of Ras/Egfr pathway signaling for prevention or treatment of invasive cancers.


Figures

Figure 1.
Figure 1.
FVB/Spret backcross carcinomas can be separated into two different categories. (A) Low-power representative view of well-differentiated SCC demonstrating invasive nests of squamous cells showing heavy keratinization and surrounded by a stromal desmoplastic response. (Insert) High-power view of well-differentiated SCC with ample cytoplasm (low N:C ratio) and well-defined cell borders. Intercellular bridges are evident. (B) Medium-power example of poorly differentiated SCC without spindle morphology. Note the lack of keratinization; however, the tumor cells retain an epithelioid appearance consisting of abundant eosinophilic cytoplasm with defined cellular borders. (Insert) At high power, intercellular bridges are not readily identified. (C,D) Examples of poorly differentiated SCCs with a mixture of epithelioid tumor cells and tumor cells acquiring subtle spindled morphology. (E) Low-power view of poorly differentiated SCCs demonstrating nests of epithelioid squamous cells transitioning into a focus of infiltrating malignant spindle cells. (F) Low-power views of pure malignant spindle cells consistent with spindle cell carcinoma (the insert shows a high-power view of spindle cells). Carcinoma category is shown at the top right corner of the pictures (bars, 100 μm). (G) Unsupervised hierarchical clustering of all microarray probe sets expressed above background separates the carcinomas into two categories. Class A (44 carcinomas) is shown on the left, and class B (16 carcinomas) is shown on the right. IHC on carcinoma sections using antibodies against p63 (H,I), E-cadherin (J,K), Vimentin (L,M), Keratin 8/18 (N,O), Slug (P,Q), and Snail (R,S), with class A carcinomas depicted on the right, and class B carcinomas depicted on the left (bar, 100 μm).
Figure 2.
Figure 2.
A subset of skin stem cell markers is expressed at higher levels in class A than in class B carcinomas. (A) Unsupervised hierarchical clustering of skin carcinoma gene expression levels using stem cell marker genes. Green indicates lower expression, and red indicates higher expression. (B) Box plots of gene expression levels of CD24a, CD44, and Epcam in primary mouse skin carcinomas measured by microarray. Class A carcinomas are shown in blue, and class B carcinomas are shown in gray.
Figure 3.
Figure 3.
Components of the Ras/EGFR signaling pathway are down-regulated in class B spindle compared with class A SCCs. (A) Unsupervised hierarchical clustering of skin carcinoma gene expression levels using genes involved in the Ras and EGFR pathways. Red indicates higher expression, and green indicates lower expression. (B–E) IHC on class A (B,C) and class B (D,E) carcinoma sections using an antibody against P-Erk1/2 (bar, 100 μm). (F,G) Western blots using a panel of cell lines representing different stages of skin tumor progression: C5N immortalized keratinocytes; P6 papilloma cells; PDV, PDVC57, B9, and E4 SCC cell lines; and H11, A5, D3, CarC, and CarB spindle cell lines. (F) Protein levels of Hras (first lane), P-Mek (second lane), total Mek (third lane), and β-actin as loading control (fourth lane). (G) Protein levels of P-Erk (first lane), total Erk (second lane), P-Akt (third lane), total Akt (fourth lane), and β-actin as loading control (fifth lane).
Figure 4.
Figure 4.
p16 expression levels as well as p16/p19 and p15 gene copy numbers differ between class A and class B carcinomas. (A) Gene expression of p16 (black points) and p15 (green points) measured by microarrays in class A and class B carcinomas. The Y-axis shows log2 expression level. Carcinomas are sorted according to p16 array expression levels. (B) Quantitative RT–PCR (qRT–PCR) for p16 in class A and class B carcinomas. Error bars represent standard deviation from three replicate measurements. Carcinomas are sorted according to p16 qRT–PCR expression levels. (C) Gene copy number analysis of p16/p19 (top row) and p15 (bottom row). Amplifications of the genes are marked with blue, deletions are marked with red, and two copies are indicated with white boxes. (D) Western blot depicting levels of p16 (lane 1) and β-actin as loading control (lane 2) in a panel of cell lines representing different stages of skin tumor progression. Immunohistochemistry on class A (E) and class B (F) carcinoma sections using an antibody against p19/Arf (bar, 100 μm).
Figure 5.
Figure 5.
Carcinoma incidence and dependence on inflammation. (A) Numbers of SCCs (blue bars) and spindle cell carcinomas (gray bars) observed in wild-type FVB/N mice after a single dose of DMBA and subsequent biweekly TPA treatments for 5 wk (n = 10 mice), 10 wk (n = 12 mice), or 20 wk (n = 22 mice). All groups of mice were killed when carcinomas reached a minimum size of 1.5 cm in diameter. (B) Kaplan-Meier survival curves showing carcinoma incidence of wild-type mice (blue line; n = 23 mice) and Hras−/− mice (black line; n = 21 mice) treated with TPA for 20 wk. The difference between the curves was statistically significant (P = 0.0006). A very similar result was obtained in a completely independent experiment involving 24 wild-type and 22 Hras−/− mice (P = 0.0024).
Figure 6.
Figure 6.
Schematic models of the possible origins of class B carcinomas. (A) Class B carcinomas could arise from class A squamous tumors. (B) Both class A and class B carcinomas could arise from similar papillomas that undergo separate genetic events. (C) Class A and class B carcinomas could have the same cell of origin but diverge at an early stage, giving rise to different kinds of premalignant lesions. (D) Class A and class B carcinomas could have two completely different cells of origin in the skin.

References

    1. Adorno M, Cordenonsi M, Montagner M, Dupont S, Wong C, Hann B, Solari A, Bobisse S, Rondina MB, Guzzardo V, et al. 2009. A mutant-p53/Smad complex opposes p63 to empower TGFβ-induced metastasis. Cell 137: 87–98 - PubMed
    1. Al-Hajj M, Clarke MF 2004. Self-renewal and solid tumor stem cells. Oncogene 23: 7274–7282 - PubMed
    1. Al-Hajj M, Wicha MS, Benito-Hernandez A, Morrison SJ, Clarke MF 2003. Prospective identification of tumorigenic breast cancer cells. Proc Natl Acad Sci 100: 3983–3988 - PMC - PubMed
    1. Alam M, Ratner D 2001. Cutaneous squamous-cell carcinoma. N Engl J Med 344: 975–983 - PubMed
    1. Anastasi S, Fiorentino L, Fiorini M, Fraioli R, Sala G, Castellani L, Alema S, Alimandi M, Segatto O 2003. Feedback inhibition by RALT controls signal output by the ErbB network. Oncogene 22: 4221–4234 - PubMed

Publication types

MeSH terms