. 2013 Dec;21(12):2538-44.
doi: 10.1002/oby.20391. Epub 2013 May 29.

NMR-based metabolomics and breath studies show lipid and protein catabolism during low dose chronic T(1)AM treatment

Affiliations

NMR-based metabolomics and breath studies show lipid and protein catabolism during low dose chronic T(1)AM treatment

J A Haviland et al. Obesity (Silver Spring). 2013 Dec.

Abstract

Objective: 3-Iodothyronamine (T1 AM), an analog of thyroid hormone, is a recently discovered fast-acting endogenous metabolite. Single high-dose treatments of T1 AM have produced rapid short-term effects, including a reduction of body temperature, bradycardia, and hyperglycemia in mice.

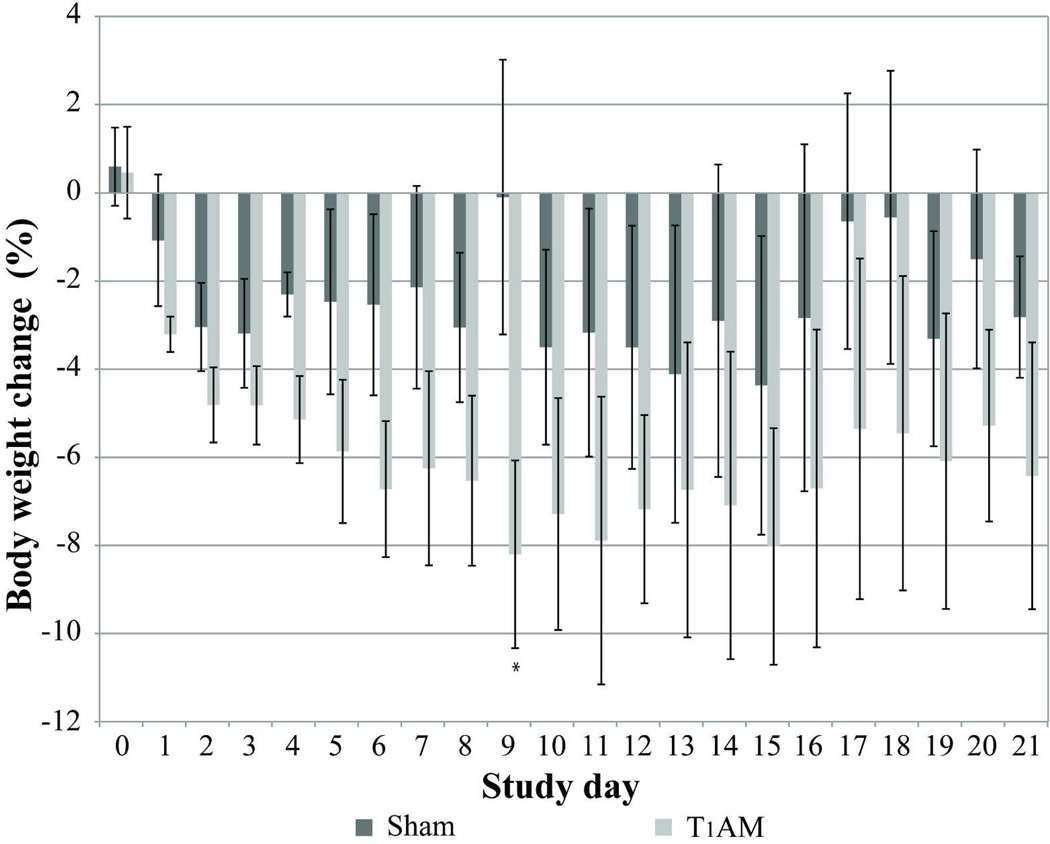
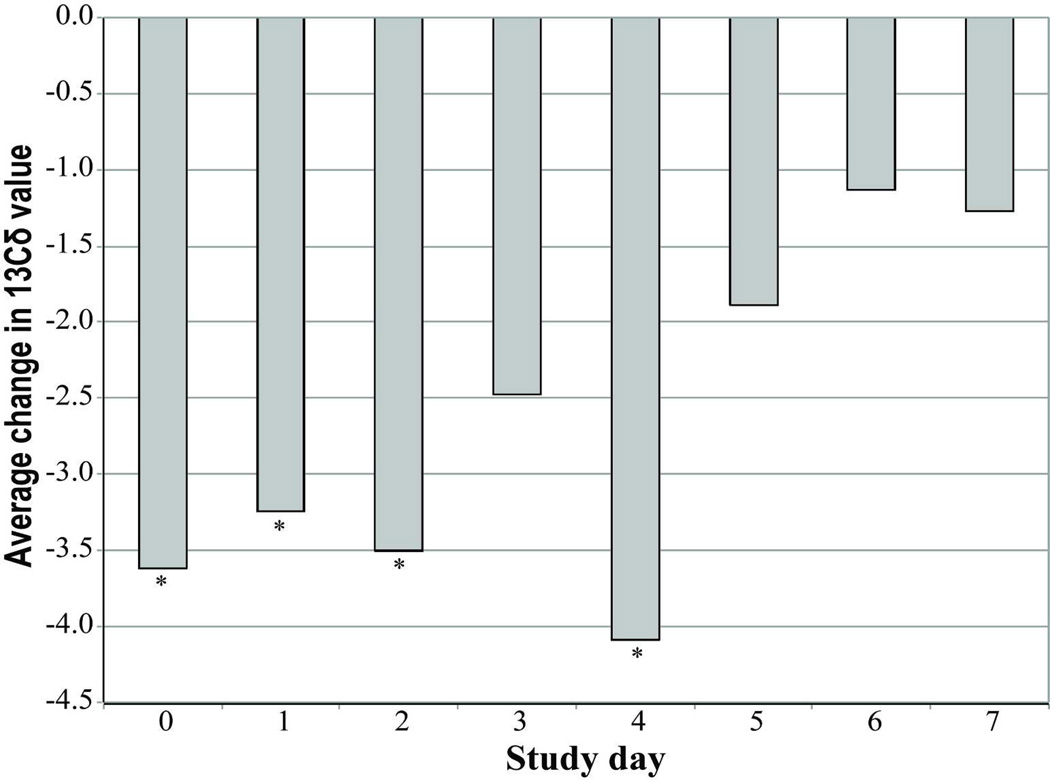
Design and methods: The effect of daily low doses of T1 AM (10 mg/kg) for 8 days on weight loss and metabolism in spontaneously overweight mice was monitored. The experiments were repeated twice (n = 4). Nuclear magnetic resonance (NMR) spectroscopy of plasma and real-time analysis of exhaled (13) CO2 in breath by cavity ring down spectroscopy (CRDS) were used to detect T1 AM-induced lipolysis.

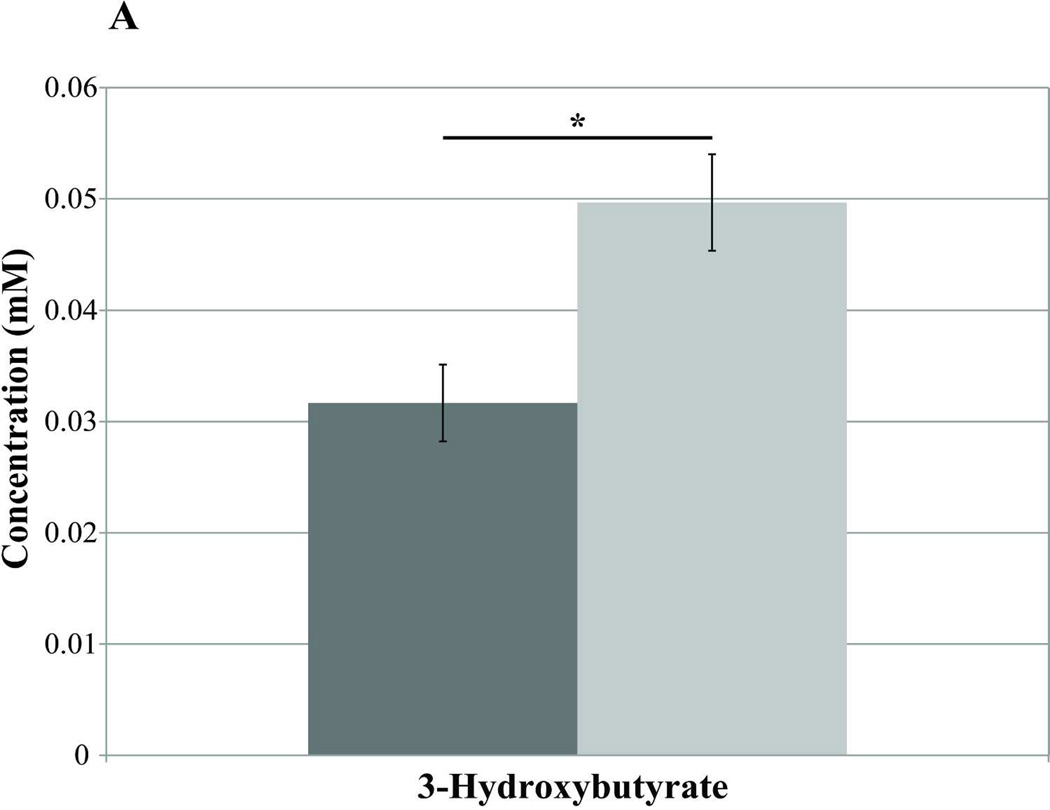
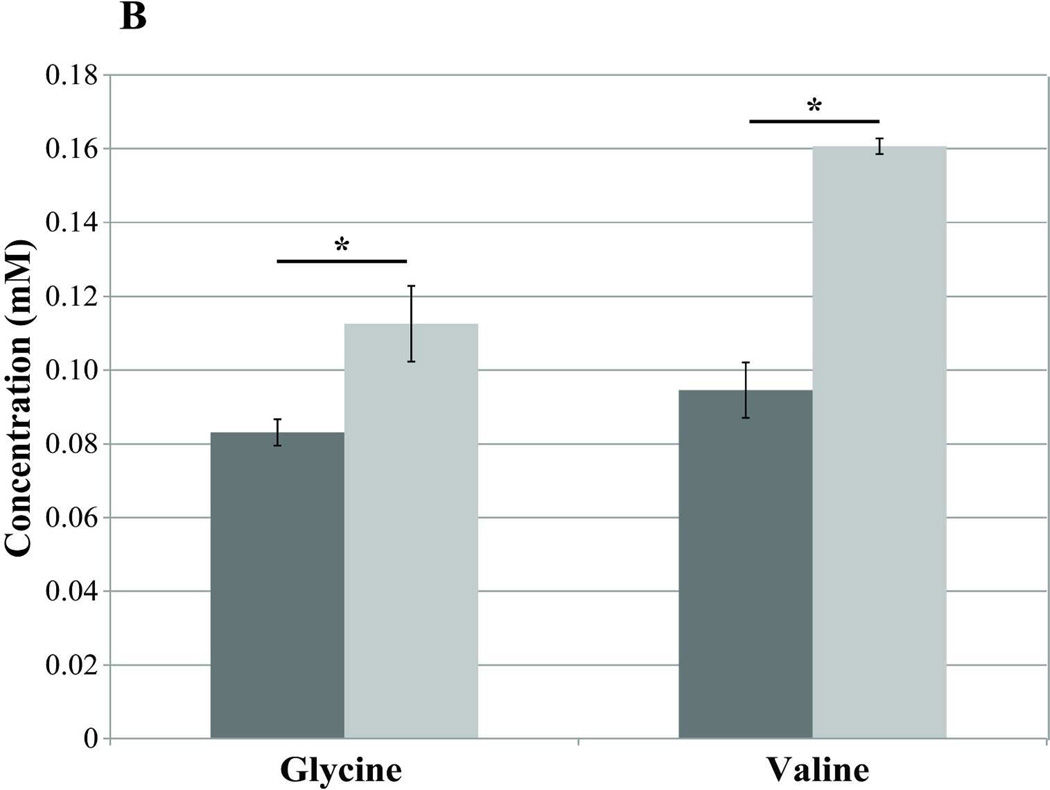
Results: CRDS detected increased lipolysis in breath shortly after T1 AM administration that was associated with a significant weight loss but independent of food consumption. NMR spectroscopy revealed alterations in key metabolites in serum: valine, glycine, and 3-hydroxybutyrate, suggesting that the subchronic effects of T1 AM include both lipolysis and protein breakdown. After discontinuation of T1 AM treatment, mice regained only 1.8% of the lost weight in the following 2 weeks, indicating lasting effects of T1 AM on weight maintenance.

Conclusions: CRDS in combination with NMR and (13) C-metabolic tracing constitute a powerful method of investigation in obesity studies for identifying in vivo biochemical pathway shifts and unanticipated debilitating side effects.


Figures

Figure 1
Figure 1. Comparison of weight loss in T1AM treated and control mice
Decrease in weight is shown as a % of body weight in T1AM treated mice (light gray bars) and sham treated mice (dark gray bars) over 21 day study period. Error bars reflect the standard error of the mean (SEM). Statistical significance (p < 0.05) compared to the vehicle treated group indicated by asterisk.
Figure 2
Figure 2. Exhaled breath analysis measured by CRDS reveals lipid breakdown
Daily stable isotope breath analyses of T1AM treated animals (n=4) are reported as the average daily δ13C values. The minimum average values are at 80 minutes (δ13C80min) post injection for each treatment day. Statistical significance with p < 0.05 are indicated by asterisks.
Figure 3
Figure 3. Analysis of plasma by NMR-based metabolomics reveals an increase in the lipid oxidation and protein break down in non-fasting condition
A) A significant increase in 3-hydroxybutyrate at day 7 of T1AM treatment. The concentration of 3-hydroxybutyrate is shown as light gray bars for T1AM treated mice (n=3) and dark gray bars for control mice (n=4) (p= 0.03). B) Increases in the plasma amino acids glycine (glucogenic) and valine (branched and ketogenic/glucogenic) in post T1AM treatment regime. Plasma samples were collected in the following two weeks after discontinuation of T1AM treatment and were two hours post [U-13C]-glucose injection. The concentration of glycine (p=0.05) and valine (p=0.001) is shown as light gray bars for T1AM treated mice and dark gray bars for sham mice. T1AM associated increases in both of these amino acids indicate a shift in energy metabolism following glucose administration. C) Increase in the plasma acetate concentration (lipid intermediate) at day 7 of T1AM post treatment. Light gray bars are for T1AM treated mice and dark gray bars represent control mice. Error bars represent the SEM. Statistical significance (p < 0.05) compared to the sham treated group are indicated by asterisks.

References

    1. Scanlan TS, Suchland KL, Hart ME, et al. 3-Iodothyronamine is an endogenous and rapid-acting derivative of thyroid hormone. Nature medicine. 2004;10:638–642. - PubMed
    1. Regard JB, Kataoka H, Cano DA, et al. Probing cell type-specific functions of Gi in vivo identifies GPCR regulators of insulin secretion. The Journal of clinical investigation. 2007;117:4034–4043. - PMC - PubMed
    1. Braulke LJ, Klingenspor M, DeBarber A, et al. 3-Iodothyronamine: a novel hormone controlling the balance between glucose and lipid utilisation. Journal of comparative physiology B, Biochemical, systemic, and environmental physiology. 2008;178:167–177. - PubMed
    1. Klieverik LP, Foppen E, Ackermans MT, et al. Central effects of thyronamines on glucose metabolism in rats. The Journal of endocrinology. 2009;201:377–386. - PubMed
    1. Axelband F, Dias J, Ferrao FM, Einicker-Lamas M. Nongenomic signaling pathways triggered by thyroid hormones and their metabolite 3-iodothyronamine on the cardiovascular system. Journal of cellular physiology. 2011;226:21–28. - PubMed

Publication types